.webp&w=1920&q=75)
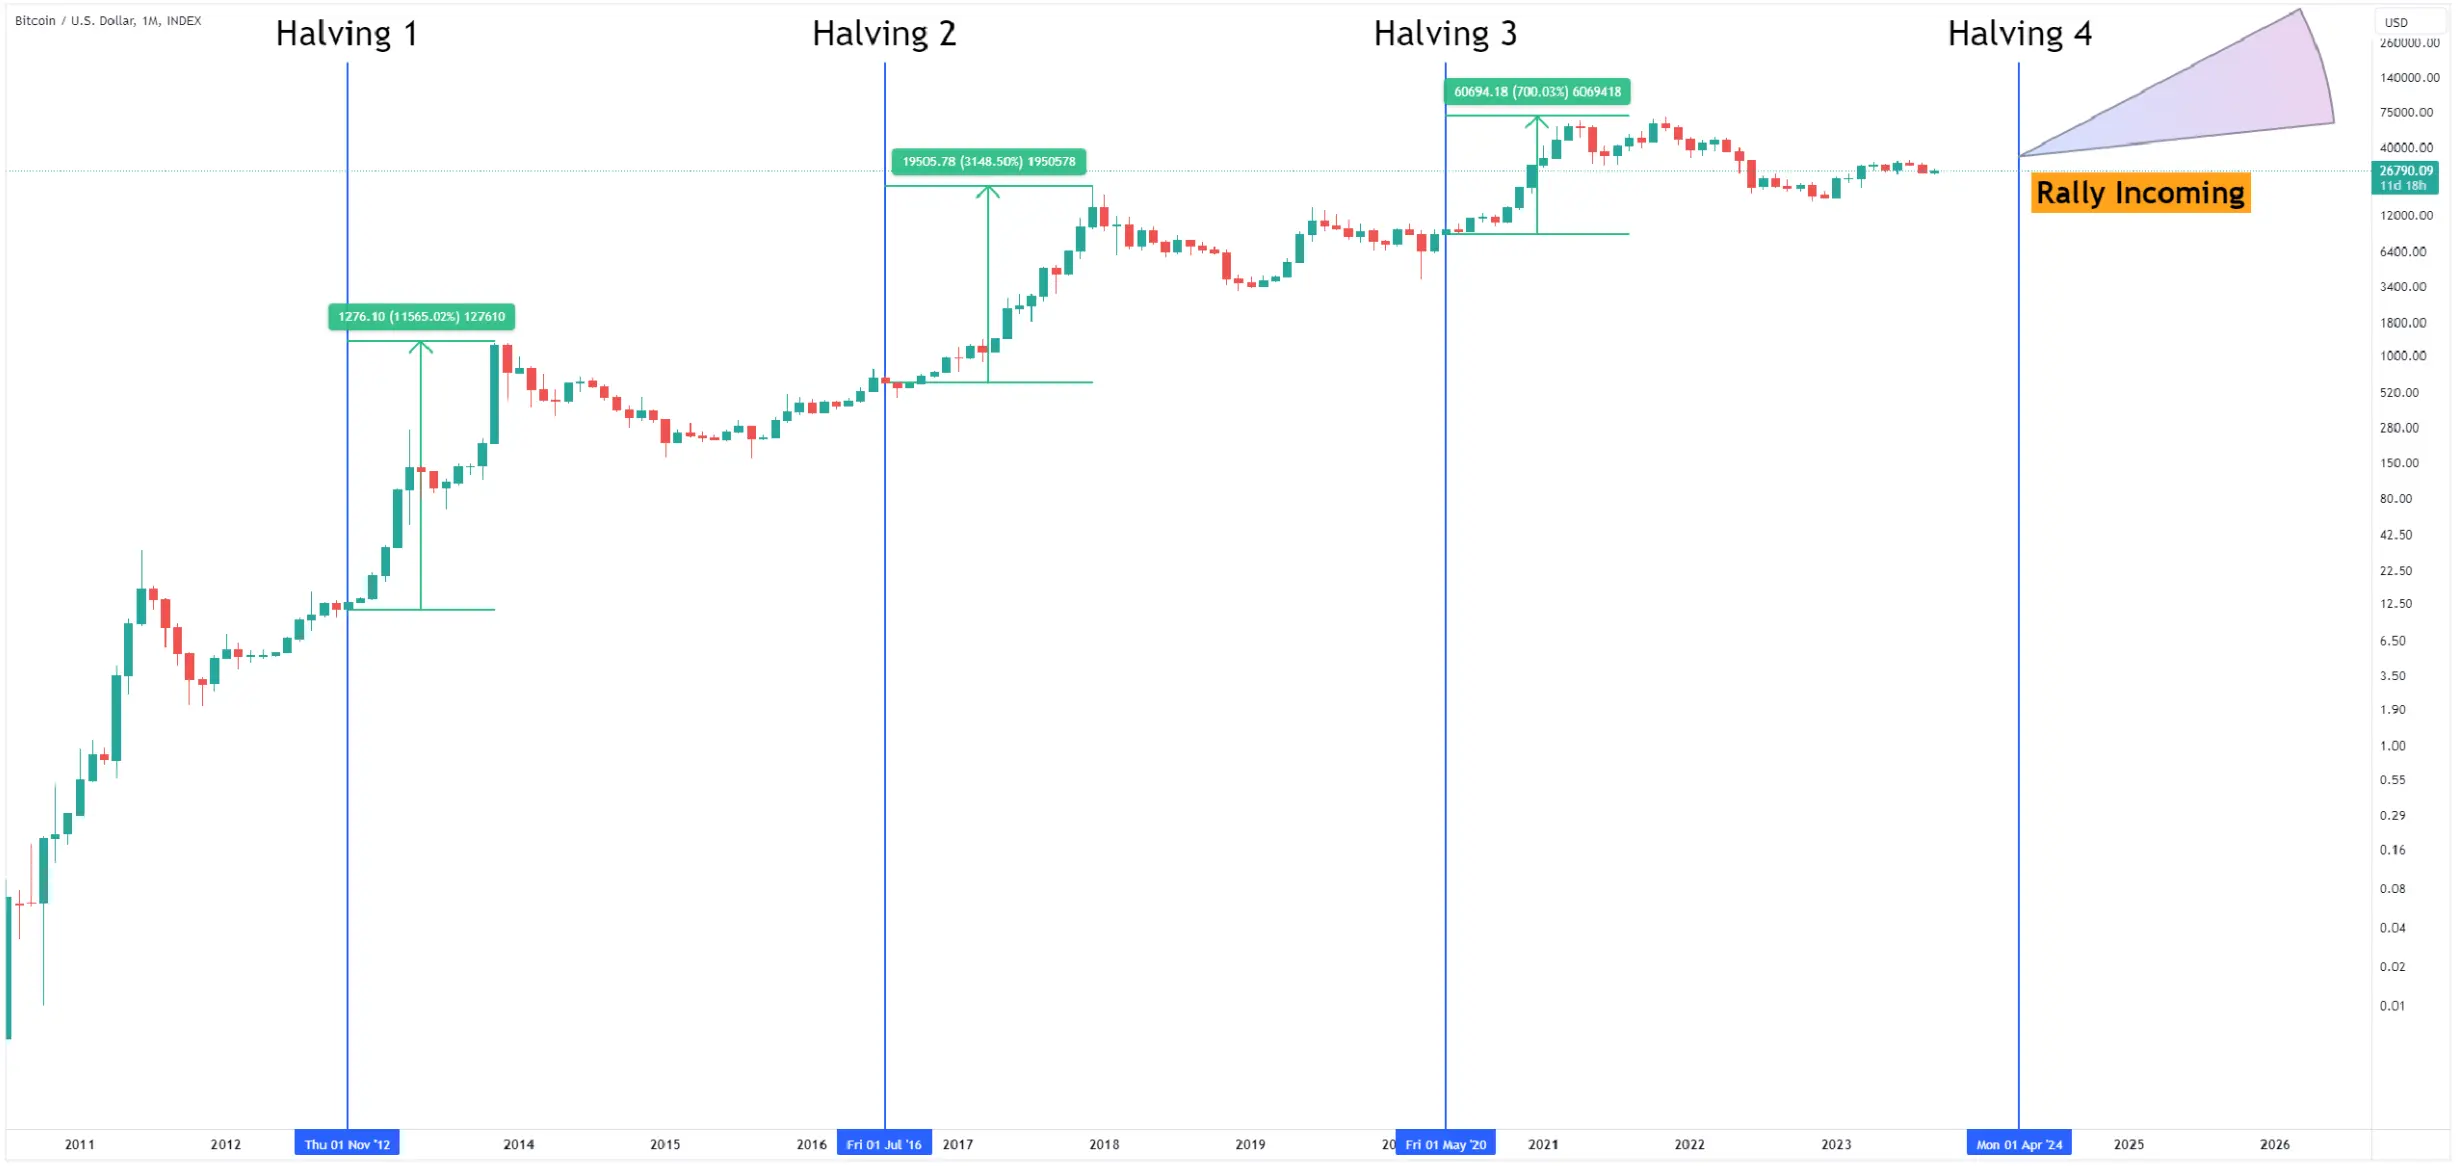
The Bitcoin halving is near, signaling the onset of a new bull market, typically marked by strong crypto market gains in the 4-year cycle.
The details: Bitcoin follows a 4-year cycle, so let's look 4 years back and predict how Bitcoin's price will behave in the future.
What is the Bitcoin “4-year cycle”?
Let's break this down in simpler terms. The Bitcoin "4-year cycle" refers to a pattern where the price of Bitcoin goes up and down every four years since it started.
This happens because of a few things, like the rewards for Bitcoin miners getting cut in half, how many people are using Bitcoin, and how confident investors feel about it.
Keep in mind that the connection between halving and Bitcoin's price isn't an exact science.
Many other factors can also affect Bitcoin's price over time. So, don't see this cycle as a surefire predictor of how Bitcoin will do in the future. It's crucial for investors to weigh the risks of any investment carefully.
Understanding the Halving Cycles Theory: Predicting Bitcoin's Path
The concept of the Bitcoin halving holds immense significance in the world of cryptocurrency.
This theory has been around since the inception of Bitcoin's price history, which began on July 18, 2010, as recorded on BLX.
Unlike some other models that focus solely on the first halving in November 2012, this theory considers both the first and second halvings, including their key dates.
So, what does this theory bring to the table?
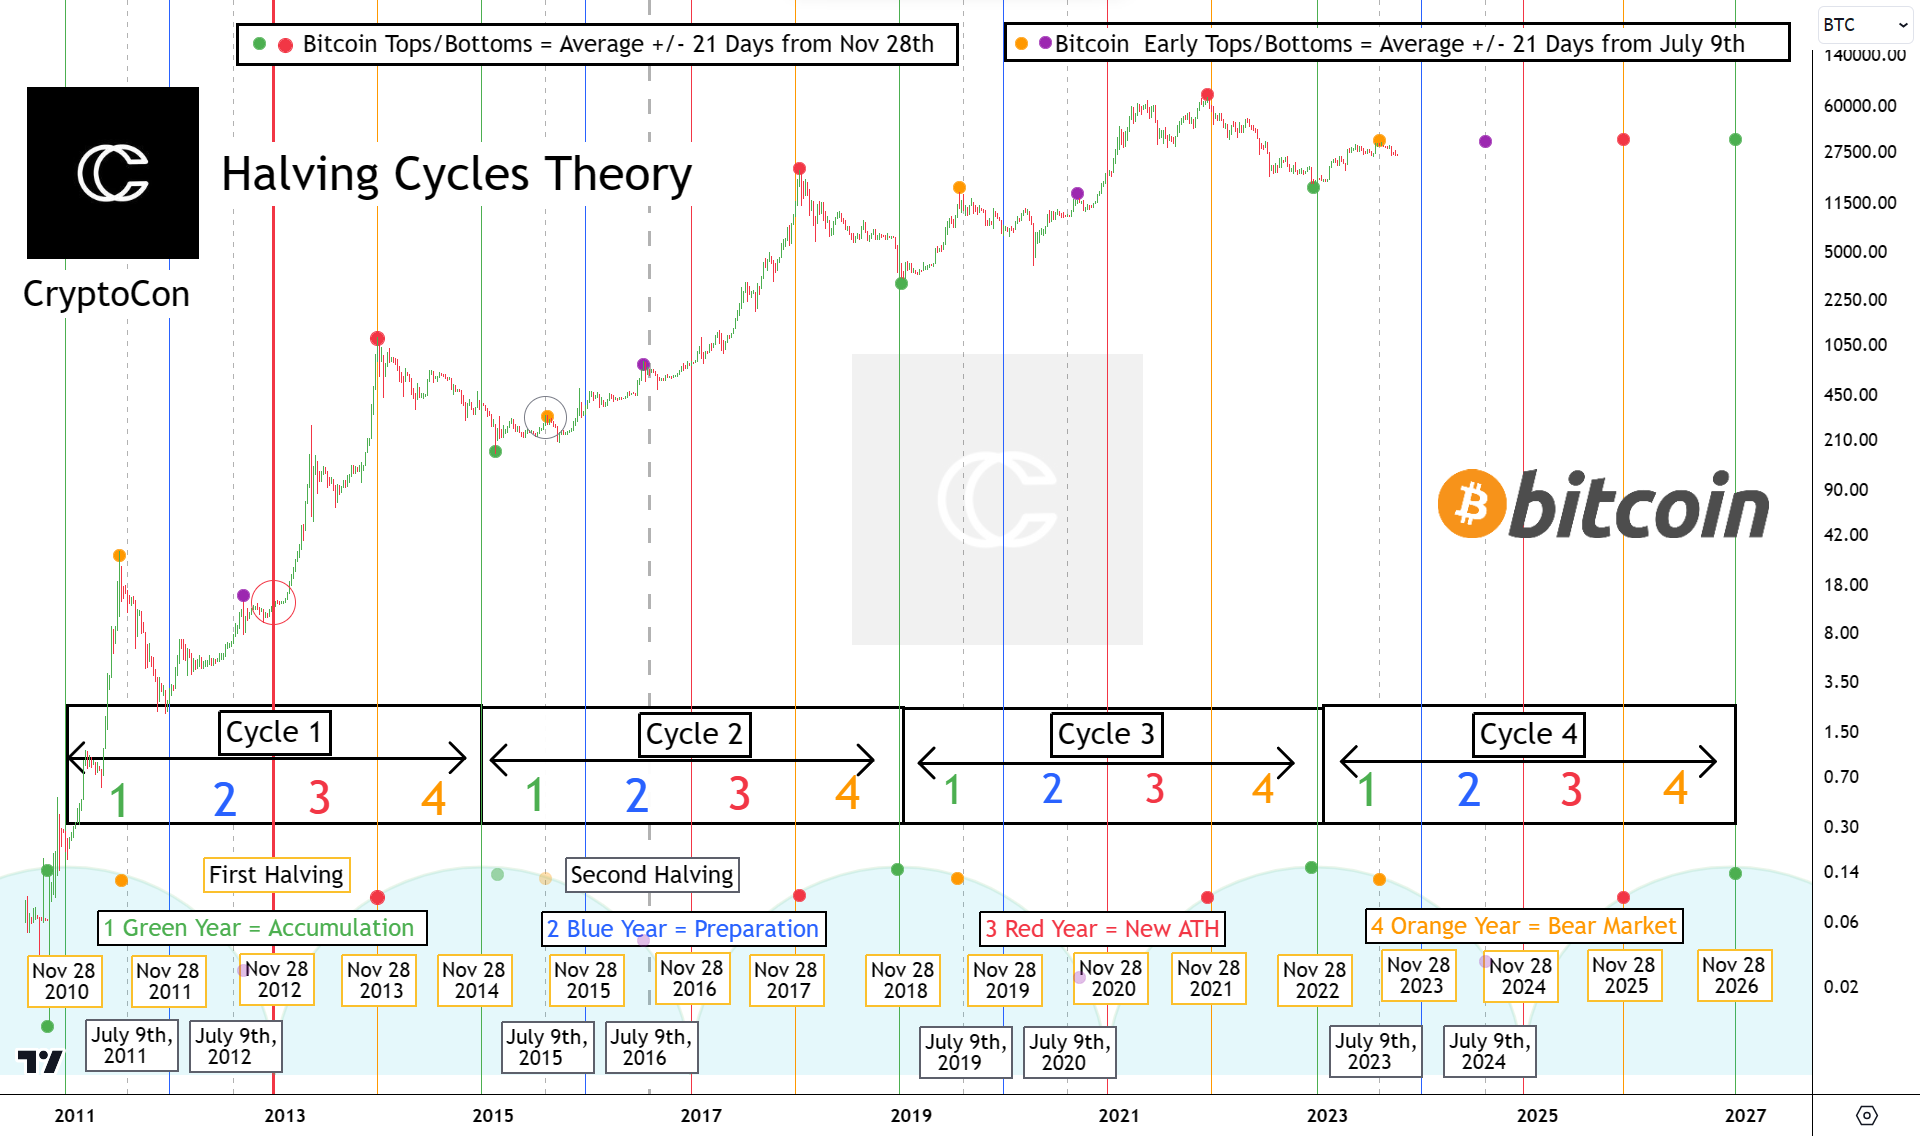
It identifies significant points within the 4-year cycles by pinpointing cycle bottoms, cycle tops, and even early tops.
These points are marked by colored dots:
Cycle Bottoms (Green Dot): These occur approximately 21 days from November 28th, signaling the start of a green year.
Cycle Tops (Red Dot): Around 21 days from November 28th, we see the end of a red year, marking a cycle top.
First Early Top (Yellow Dot): This occurs about 21 days from July 9th within a green year, signifying an early top.
Second Early Top (Purple Dot): Similarly, roughly 21 days from July 9th in a blue year, we encounter a second early top.
Interestingly, the average error rate for both early tops is exactly the same, making these predictions quite reliable.
Now, let's break down what happens in each year of the 4-year cycle:
1. Green Year (Accumulation): This is the year when Bitcoin is in an accumulation phase.
It begins with Bitcoin hitting its bottom, roughly 21 days from November 28th.
This year offers the best buying prices in the cycle, and Bitcoin steadily advances toward the median price, which is half the previous all-time high (ATH).
The first early top occurs within this year, about 21 days from July 9th, marking a period of price stabilization.
2. Blue Year (Preparation): In this year, Bitcoin establishes itself at its new fair value, the median price.
It then makes its way to the second early top, which falls around 21 days from July 9th.
By the end of the year, the price approaches but doesn't quite reach new all-time highs, setting the stage for the real bull market.
3. Red Year (New ATHs): This is the final hurrah for cryptocurrencies in the cycle.
It involves the last cycle parabola, or bull market, and Bitcoin finding its cycle top, which lands around 21 days from November 28th.
4. Orange Year (Bear Market): After reaching its cycle top, Bitcoin enters a downtrend lasting about a year. It bottoms approximately 21 days from November 28th, signaling the start of a new cycle.
So, how has this theory performed? Well, it accurately predicted the bottom at 15.5k in November 2022, identified optimal buying prices, and forecasted a move toward the median price, which was 34,500 in this cycle.
Recently, the model called for an early top on July 13, 2023, just four days from July 9th, and it's within the typical error rate.
This suggests that the first early top has occurred. The next early top is expected around 21 days from July 9th, 2024, and the subsequent cycle top is projected around 21 days from November 28th, 2025.
The cycle will continue, with the next bottom approximately 21 days from November 28th, 2026.
The Halving Cycles Theory provides valuable insights into Bitcoin's price movements, and it's based on the programmed nature of Bitcoin's halvings and these recurring cycles.
It's a tool that many investors and enthusiasts find invaluable for navigating the ever-changing world of cryptocurrencies.
This part of our blog is inspired by the post of @Cryptocon_ on X.
What Can Happen to Bitcoin in 2024?
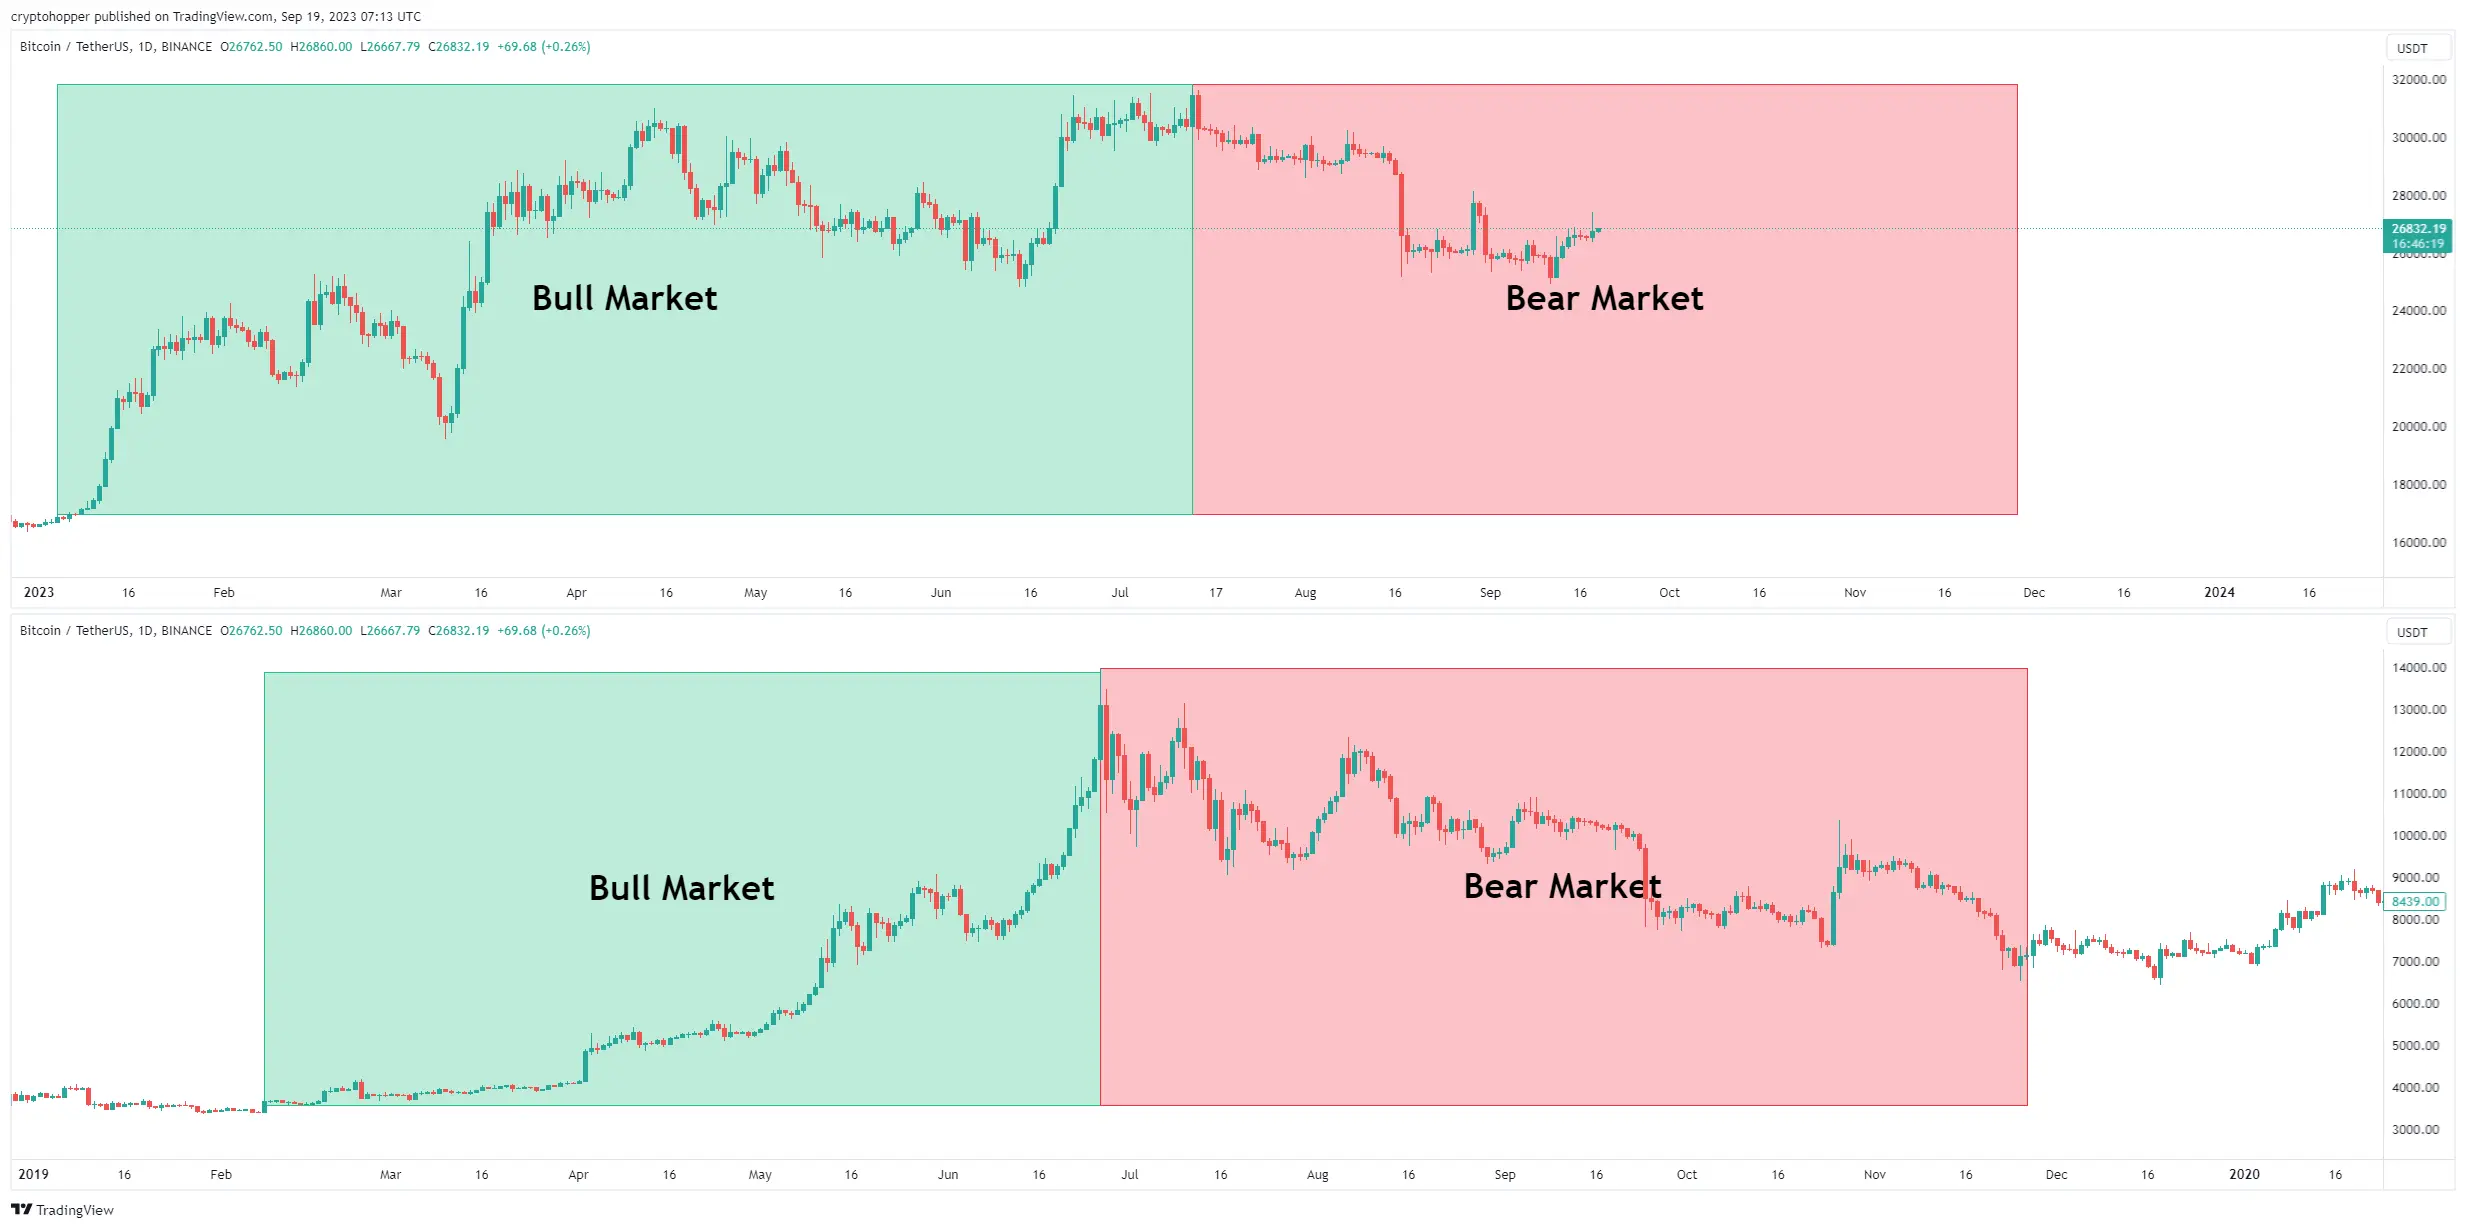
If history serves as our guide, we might witness a similar pattern in 2024 to what we saw in 2020.
However, it's crucial to understand that the upcoming rally and the subsequent bear market could have different percentages compared to what we experienced in 2020.
As the saying goes, "history does not repeat itself, but it often rhymes."
This means that while 2024 may bear some resemblance to 2020, it won't be an exact copy.
So, here's what's most likely to happen:
The current correction in the market will probably wrap up around November or December 2023.
This suggests that Bitcoin's bull market is likely to kick off at the start of 2024, or possibly towards the end of 2023.
While there will be corrections along the way, they're unlikely to be as severe as the one triggered by COVID-19 in March 2020.
Following this, we'll probably witness a mostly uninterrupted bull run until the year's end.
For those considering trading cryptocurrencies in 2024, it seems like a promising year for long positions.
If you're into technical analysis and rely on technical indicators, trend-following indicators are likely your best bet.
They tend to work exceptionally well when the market has a clear direction, as they can accurately predict the start and end of trends, capturing most of the profit.
It's worth noting that while the market might follow a similar pattern to 2020, it will likely be less volatile.
Bitcoin has exhibited decreasing volatility with each new cycle in its history, and this trend is likely to continue.
Although Bitcoin saw a remarkable 700% surge following the 2020 halving, we might expect a somewhat smaller rally this time, possibly in the range of 200% to 300% after the April 2024 halving.
Despite Bitcoin's decreasing volatility, the cryptocurrency market as a whole remains highly volatile, especially the newer altcoins entering the scene.
Generally, older cryptocurrencies tend to be more stable. So, if you're seeking more volatility, you might want to explore the newer cryptocurrencies rather than the well-established ones with larger market capitalizations.
Does the Bitcoin Bull Market influence other Crypto to start a Bull Run?
During a bull market, as the price of Bitcoin increases, it usually provides a positive catalyst for the other cryptocurrencies, making their price increase in turn.
When the price of Bitcoin goes up, it can create a feeling of optimism and confidence in the market, which can also lead to increased demand for altcoins.
Additionally, the rise in the price of Bitcoin may also lead to increased coverage and interest in the market, which can further contribute to the demand for other cryptocurrencies.
Bottom Line: Bitcoin has been following a 4-year cycle pretty rigorously, and if history is to repeat itself, we will continue to see a short bear market until November/December, from where we will witness an almost uninterrupted bull run next year.


_webp.webp&w=1920&q=75)
_webp.webp&w=1920&q=75)