
Explore top trend indicators for crypto trading, including moving averages, MACD, MESA, and Parabolic SAR, for effective market analysis strategies.
When you're searching for trends as a trader, the first thing to check is the price, which often moves between two lines. These lines together create a channel, and this channel can either be trending upwards or downwards.
Once you identify a trend, you'll follow your strategy and aim for profits as long as the trend continues. When the trend eventually changes, traders typically pause their strategy, reassess it, and make adjustments to adapt to the new trend.
It's common for traders to get nervous and sell when prices dip slightly. However, by analyzing the trend, you may realize that the drop was just a minor hiccup in an overall upward price trend. This can help you make more informed decisions and avoid panic selling.
Therefore looking at trends could be good an indication to view larger potential shifts in prices.
Moving averages are the most commonly used technical indicators in trend trading.
Moving Averages
As a trader, you'll find moving averages to be a valuable tool for your analysis. They work by calculating price averages over specific time periods, which can help you spot new trends and trend reversals. These averages are great at smoothing out price fluctuations.
You can use shorter periods like 5, 10, 20, or 50 to focus on short-term trends, especially those close to the current asset price. For longer-term trends, consider using periods like 50, 100, or 200.
The two main types of moving averages you'll often encounter are Simple Moving Averages (SMA) and Exponential Moving Averages (EMA). A Simple Moving Average is a standard average based on a set number of periods.
On the other hand, an Exponential Moving Average gives more importance to recent periods, making it track the price more closely compared to an SMA.
Both SMA (Simple Moving Averages) and EMA (Exponential Moving Averages) serve various purposes.
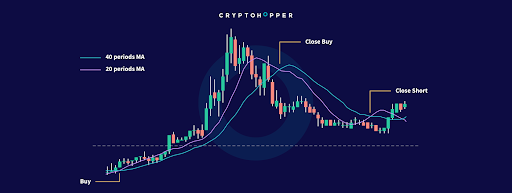
One common use is to spot trend reversals, which occurs when a shorter moving average crosses a longer one, as illustrated in 'Figure 1' where a '20-period moving average' crosses a '40-period moving average.' It's a straightforward concept: when the short-term trend intersects with the long-term trend, it indicates a potential trend reversal.
Certain trading strategies rely solely on a single 'moving average' indicator to identify either the lower or upper boundary of a trend channel. In a downward trend, this moving average acts as resistance, while in an upward trend, it serves as support.
Depending on the number of periods used in the moving average, you can pinpoint long-term, medium-term, or short-term support and resistance levels. The more periods considered, the longer-term trends the indicator will help you identify.
The MACD Indicator
The Moving Average Convergence/Divergence (MACD) is a widely used moving average indicator. It compares a 26-candle Exponential Moving Average (EMA) to a 12-candle EMA.
To calculate the MACD line, you subtract the first EMA from the second EMA. Additionally, there's a signal line, which is a 9-candle EMA of the MACD line.
This technical indicator is usually used to foresee trend reversals and trades along upward and downward trends. There are two ways in which you can use the MACD:
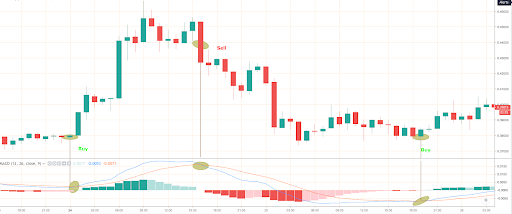
Through bullish and bearish crossovers between the MACD and the signal line
A bullish signal will occur when the MACD line rises above the signal line. What this suggests is that the movement of the price will be upwards. A bearish signal occurs when the MACD line goes below the signal line, insinuating exactly the opposite. You can use this version of the MACD in this way on Cryptohopper.
MACD line and price divergences
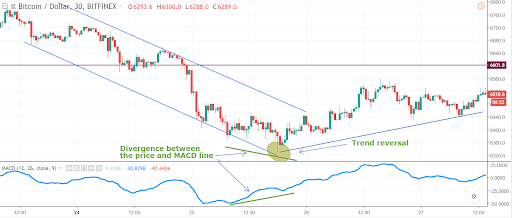
Using the MACD can be a powerful tool to identify the end of a bullish or bearish trend. When you notice a divergence between the price and the MACD line during a downtrend, as illustrated in "Figure 2", it's considered a buy signal.
In this scenario, while the price is still trending downward, the MACD line starts to rise, indicating that the current downtrend may be coming to an end. This situation could signal a potential trend reversal, presenting you with a trading opportunity.
MESA
The MESA Adaptive Moving Average is another trend-following indicator, much like the EMA. However, there's a key distinction between the MESA and the EMA and SMA on Cryptohopper: the MESA generates sticking signals, while the EMA/SMA do not.
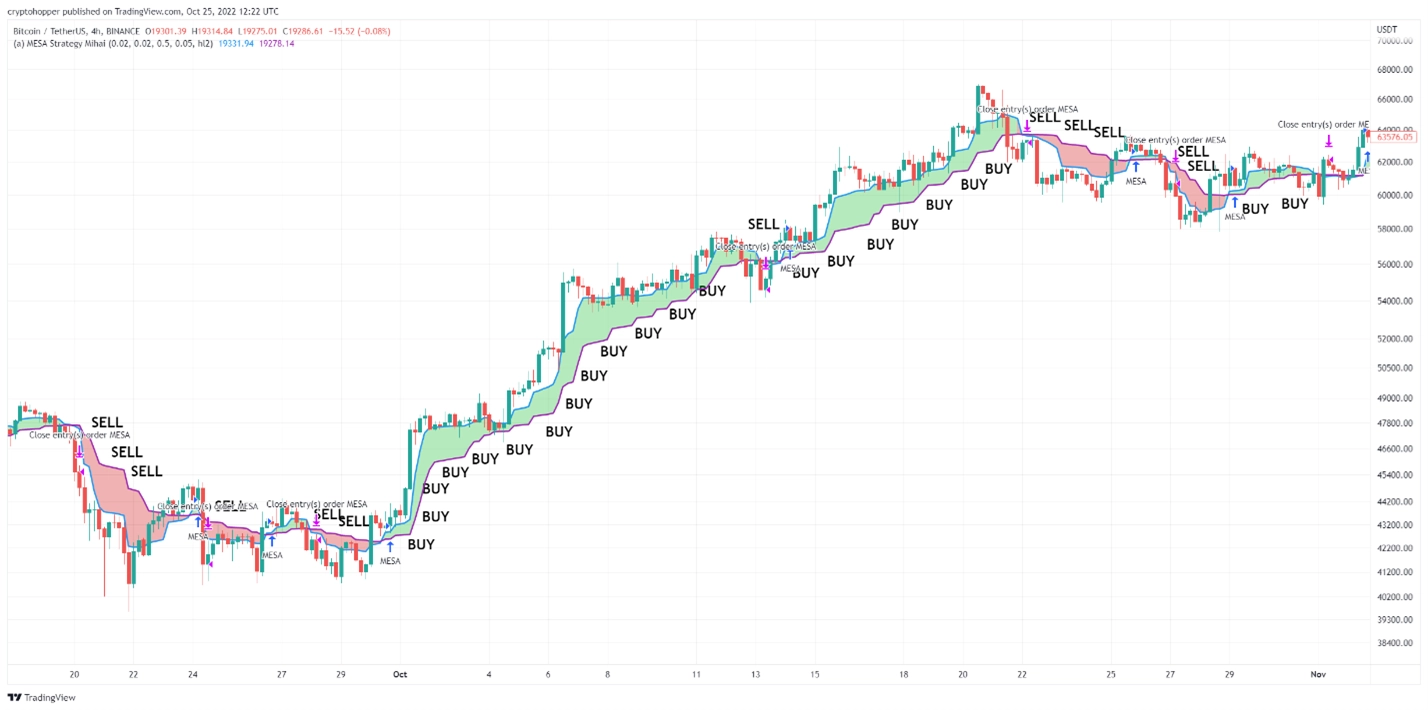
When the moving average, often referred to as the MAMA, remains above the MESA's long moving average, known as the FAMA, it triggers a buy signal.
Some trading platforms even display a green cloud when the MAMA is above the FAMA, which provides a helpful visual cue. Conversely, when the situation reverses, a red cloud appears on the chart.
The MESA and EMA employ different mathematical formulas, leading to varying reactivity. The MESA is an adaptive moving average, meaning its sensitivity to price changes adjusts based on market conditions.
In terms of inputs, the MESA differs significantly from the EMA. Its default values are 0.5 for the Fast limit and 0.05 for the Slow limit. Larger values result in more trades, so, for example, setting a Fast limit of 0.7 and a Slow limit of 0.075 will generate more trades than the default settings.
When it comes to sell settings, the MESA typically pairs well with a stop loss. Using a take profit or trailing stop loss may hinder its ability to secure significant gains. The MESA is most effective on larger timeframes, such as the 4-hour chart or higher.
However, one of its standout features is its compatibility with other indicators. The MESA, as a trend-following indicator with sticking signals, serves excellently as a filter.
A filter, in this context, is a technical indicator that helps sift out false signals. One of the best applications for the MESA is to place it on longer timeframes to determine the trend's direction.
Once the MESA identifies the overall trend, you can utilize an oscillator like the RSI or Williams %R on a shorter timeframe to pinpoint entry and exit points. Other indicators that can complement the MESA filter on a shorter timeframe include the MACD and Bollinger Bands, as well as additional moving averages.
So that's a glimpse of the MESA, one of our favorite indicators. However, there are other fantastic options to explore, such as the Parabolic SAR.
Parabolic SAR
The Parabolic SAR, or PSAR for short, is another indicator in the same vein as the MESA. Essentially, the Parabolic SAR is yet another trend-following indicator that provides sticking signals.
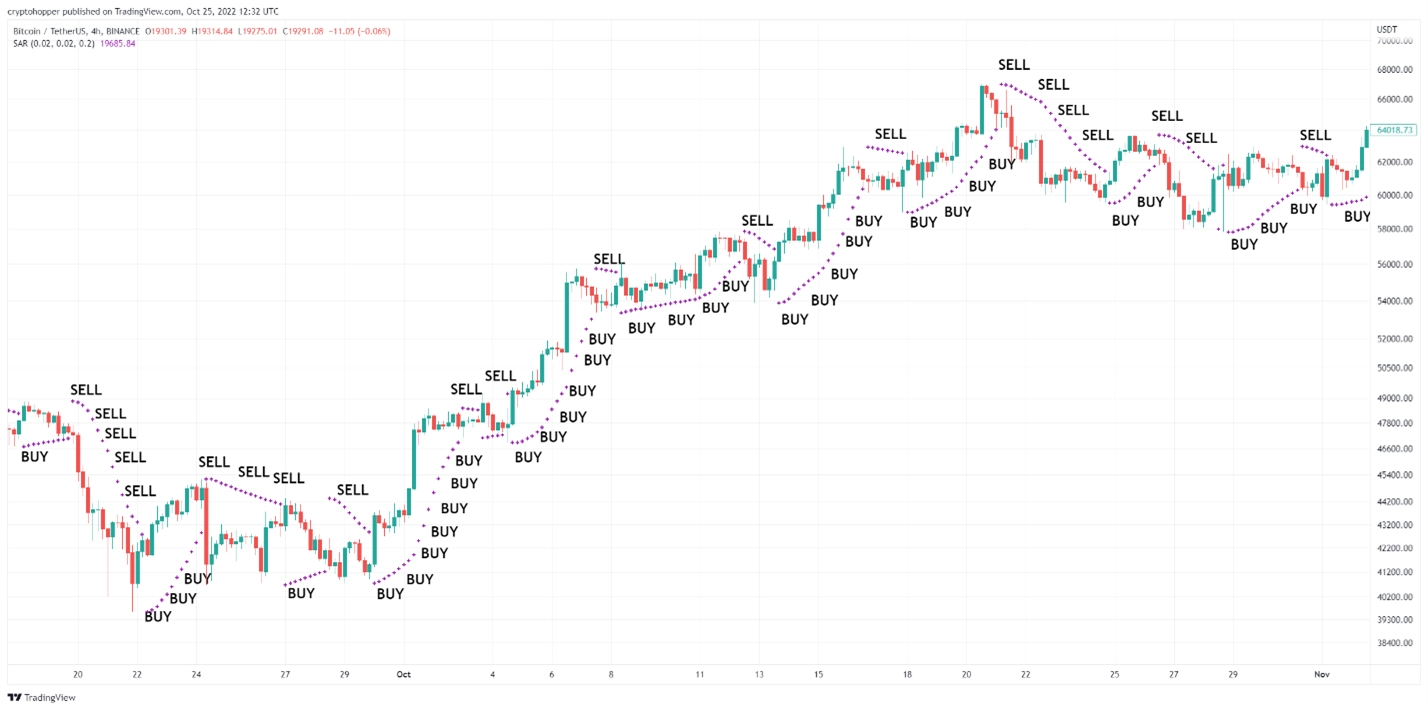
However, its appearance on the chart is quite distinct from the MESA. The PSAR typically consists of small crosses or dots, which can vary depending on the trading platform. These marks appear either below or above the candlesticks.
So, when you're analyzing a chart, if you see the crosses positioned below the candles, it signifies a bullish Parabolic SAR, and it will continue sending buy signals.
Conversely, when the crosses are located above the candles, it indicates a bearish indicator, and it will persistently generate sell signals.
Using the Parabolic SAR on Cryptohopper
On Cryptohopper, the Parabolic SAR shares quite similar input settings with the MESA. The default values include 0.02 for the Acceleration Factor and 0.2 for the Maximum.
Just like with the MESA, higher values for these parameters result in more frequent switches between buy and sell signals.
A key distinction between the Parabolic SAR and the MESA is the Parabolic SAR's heightened sensitivity to trend changes, making it react more quickly.
This characteristic makes the PSAR a more suitable filter for cryptocurrencies that tend to change directions rapidly.
Another factor that sets these two indicators apart is how they treat the highs and lows of candlesticks. For the Parabolic SAR, the highs and lows of candles are of paramount importance.
If the high or low of a candle touches the cross of a Parabolic SAR, the indicator will change direction accordingly. For instance, if the Parabolic SAR is bullish with crosses positioned below the candles, and a candle exhibits a substantial downward wick touching its low, the Parabolic SAR will become bearish, and the crosses will shift above the candles.
In contrast, the MESA, by default, primarily considers closing prices and disregards highs and lows.
However, it's important to note that the Parabolic SAR may not perform well with cryptocurrencies that experience significant swings in both their highs and lows.
For such coins, where the overall trend remains consistent despite these fluctuations, the Parabolic SAR can change direction too frequently. In these cases, the MESA may be more suitable.
With that, we've covered the Parabolic SAR. Now, let's delve into the final indicator for today, the Bollinger Bands, often abbreviated as "BB."
Bottom Line:
Mastering the art of technical analysis and utilizing trend indicators is essential for successful cryptocurrency trading. By closely monitoring price trends and employing tools such as moving averages, MACD, MESA, and Parabolic SAR, traders can gain valuable insights into market dynamics.
These indicators not only help identify trends but also assist in pinpointing potential trend reversals and entry/exit points. Additionally, the adaptability and compatibility of these indicators with various timeframes and other technical tools provide traders with a versatile toolkit to navigate the volatile cryptocurrency market.
Whether you are a novice or an experienced trader, understanding and incorporating these trend indicators can significantly enhance your ability to make informed and profitable trading decisions in the ever-evolving world of cryptocurrencies.


_webp.webp&w=1920&q=75)
_webp.webp&w=1920&q=75)