Bitcoin hovers at a critical juncture, with on-chain indicators suggesting a potential market bottom formation. Key support zones and technical levels will determine the cryptocurrency's near-term trajectory.
Bitcoin hovers around $108,000-$109,000, showing muted price action that masks underlying market dynamics suggesting a potential bottom formation and possible upcoming rally.
The Spent Output Profit Ratio (SOPR) for short-term holders has dropped to 0.982, indicating significant selling pressure and potential market capitulation. Historically, such moments often precede market reversals, clearing out weak hands and creating conditions for stronger investors to enter.
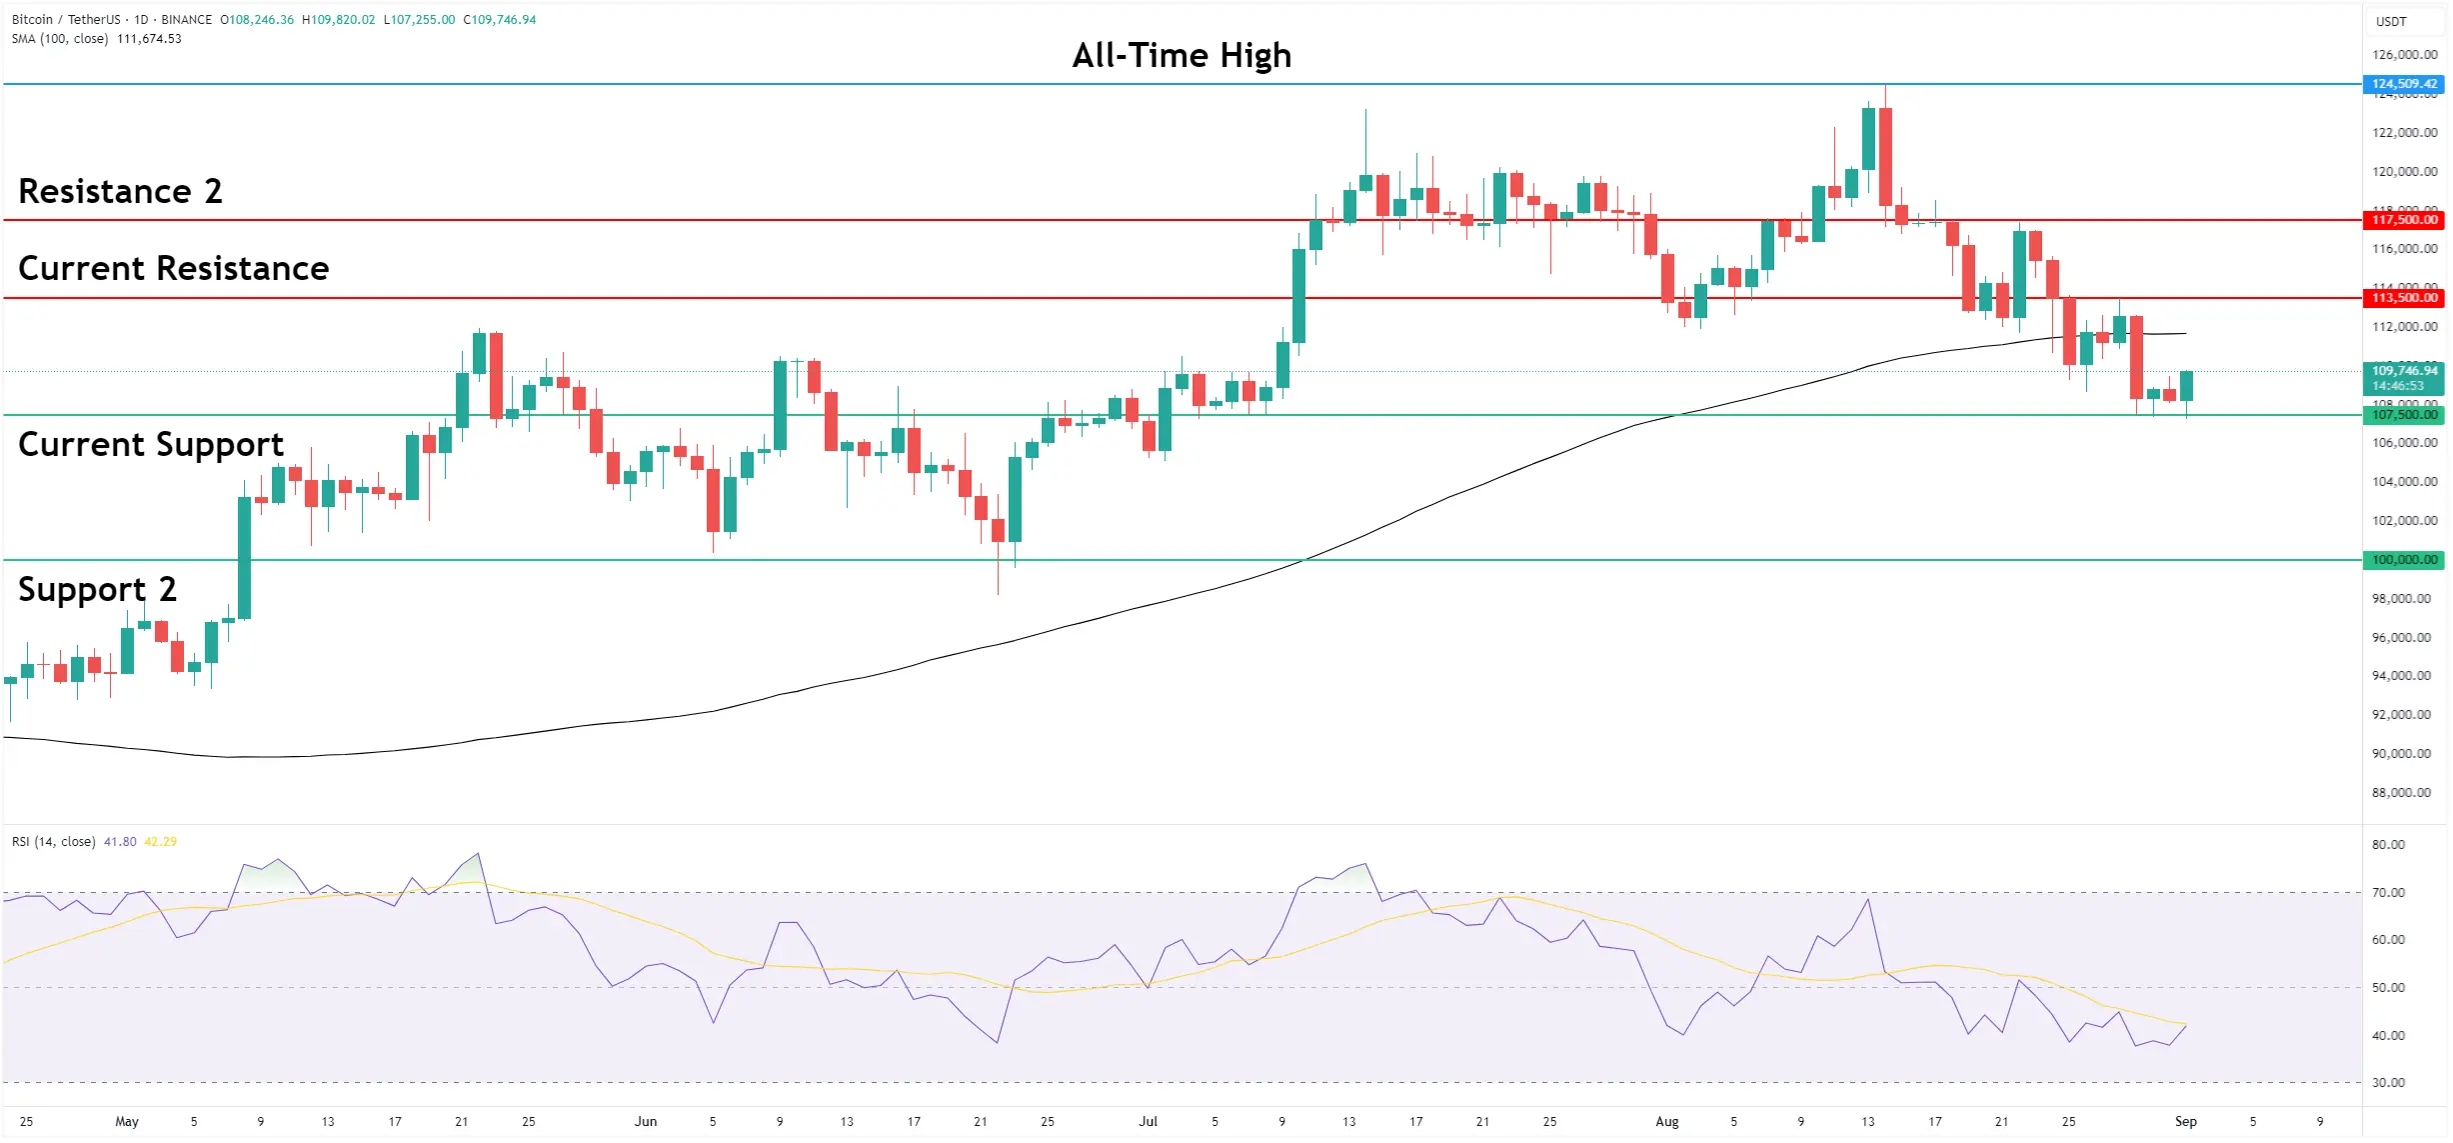
Chart by TradingView
Critical Support Zone
A critical support zone emerges around $107,000-$108,000, where substantial Bitcoin supply is concentrated. This area has acted as a strong defensive line for investors, explaining the cryptocurrency's ability to maintain support despite recent selling pressure.
Technical analysis reveals key resistance levels that will determine Bitcoin's near-term trajectory. The $113,500 zone stands out as the most critical psychological and technical barrier. Reclaiming this level could signal a significant trend reversal, while failing to do so may extend the current bearish sentiment.
Analysts note a potential parallel with previous market bottoms. The current SOPR pattern resembles the April 17 market low, when Bitcoin bottomed at $84,800 before rebounding 31.6% to $111,600. Similar market structures suggest the possibility of an impending recovery.
Immediate support exists at $107,500, with the first sign of strength being a reclaim of $110,000. A more significant breakout zone is the $113,500. A push above $117,500 could confirm renewed market strength, while a breakdown below $107,000 would invalidate the potential bottom formation.
Looking Ahead: The market remains in a delicate balance, with on-chain indicators suggesting accumulated selling pressure may be nearing exhaustion. Investors are closely watching these key levels for signs of a potential trend reversal.


_webp.webp&w=1920&q=75)
_webp.webp&w=1920&q=75)