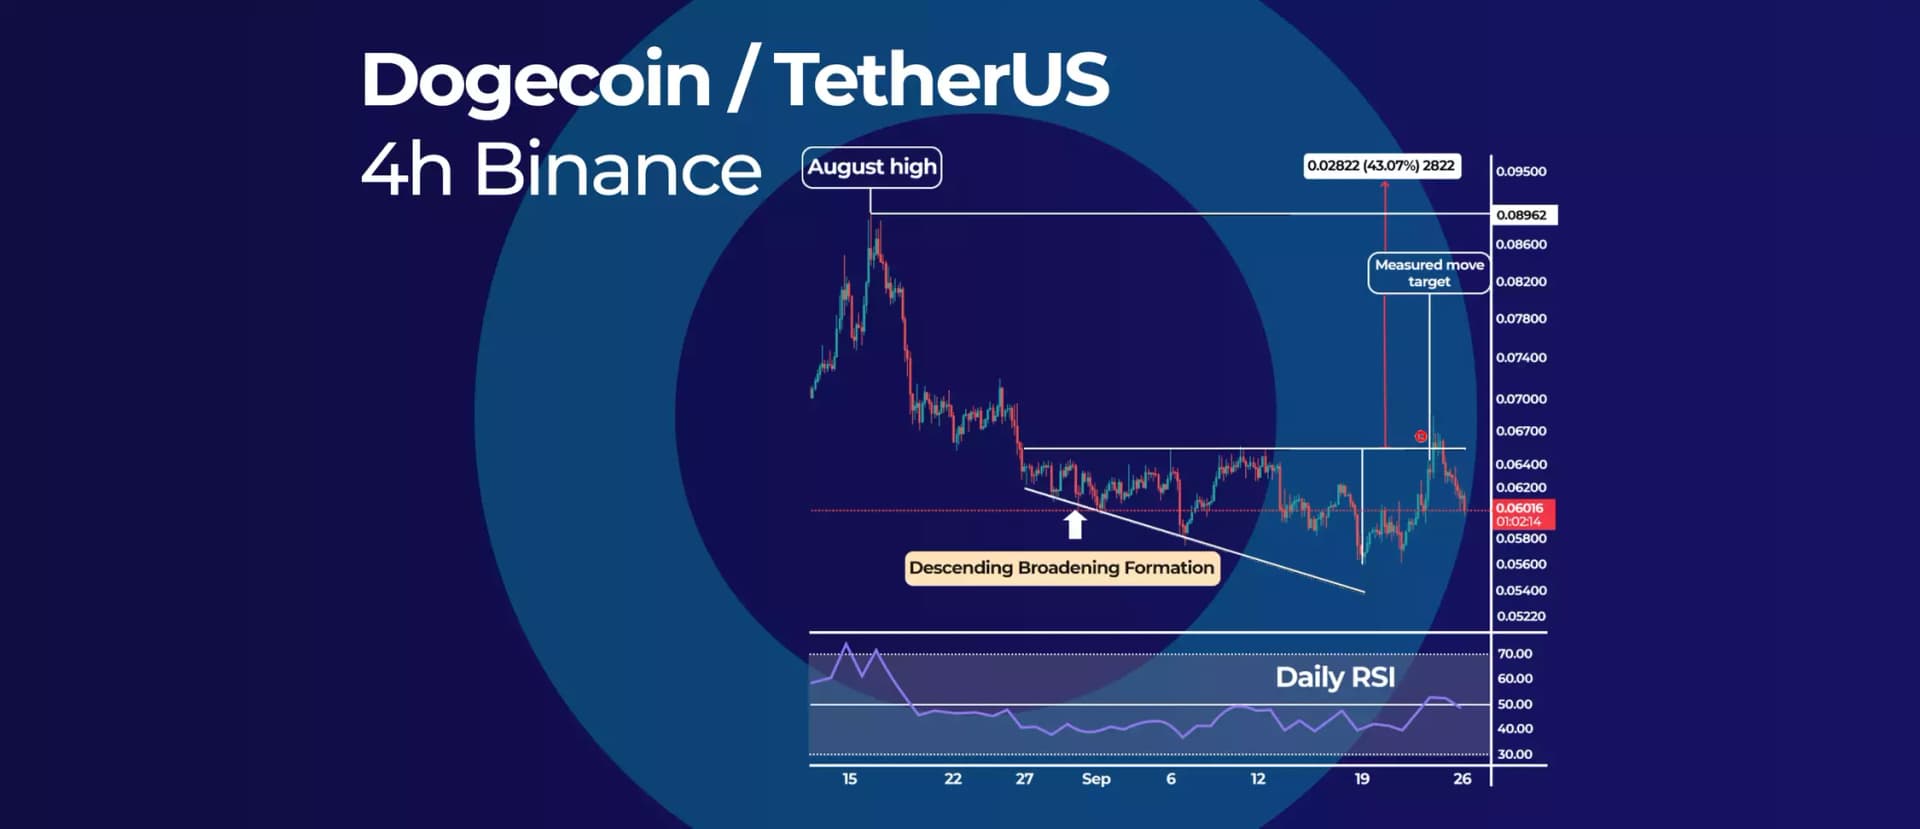
Dogecoin's (DOGE) price has just confirmed a descending broadening pattern which usually has a bullish effect. Some research finds that this price formation usually leads to a 43% average rise in the price. If this pattern materializes, the average DOGE price will be around $0.095.
DOGE Broadening Formation
The descending broadening formation is similar to the megaphone chart pattern but tilted down, with the top trendline being horizontal. DOGE's top horizontal resistance level can be found at the $0.065 level and the lowest point of the pattern at the $0.055 low.
The top resistance level has been breached, which confirms the descending broadening formation. In terms of price targets, we can either expect a 43% rally, or alternatively, we can use the measured move price target.
The measured move price target is obtained by measuring the height from the horizontal resistance level to the lowest level of the broadening formation. The estimated average DOGE measured move price target will be around the $0.075 level.
RSI Indicator
The daily Relative Strength Index (RSI) has broken above the 50 mid-level for the first time since August's rally. This positive development adds an extra layer of confirmation to the descending broadening formation breakout.
Would you like to know more about Meme coins like DOGE? Read the blog The Potential Future of Meme Coins in 2022 here.


_webp.webp&w=1920&q=75)
_webp.webp&w=1920&q=75)