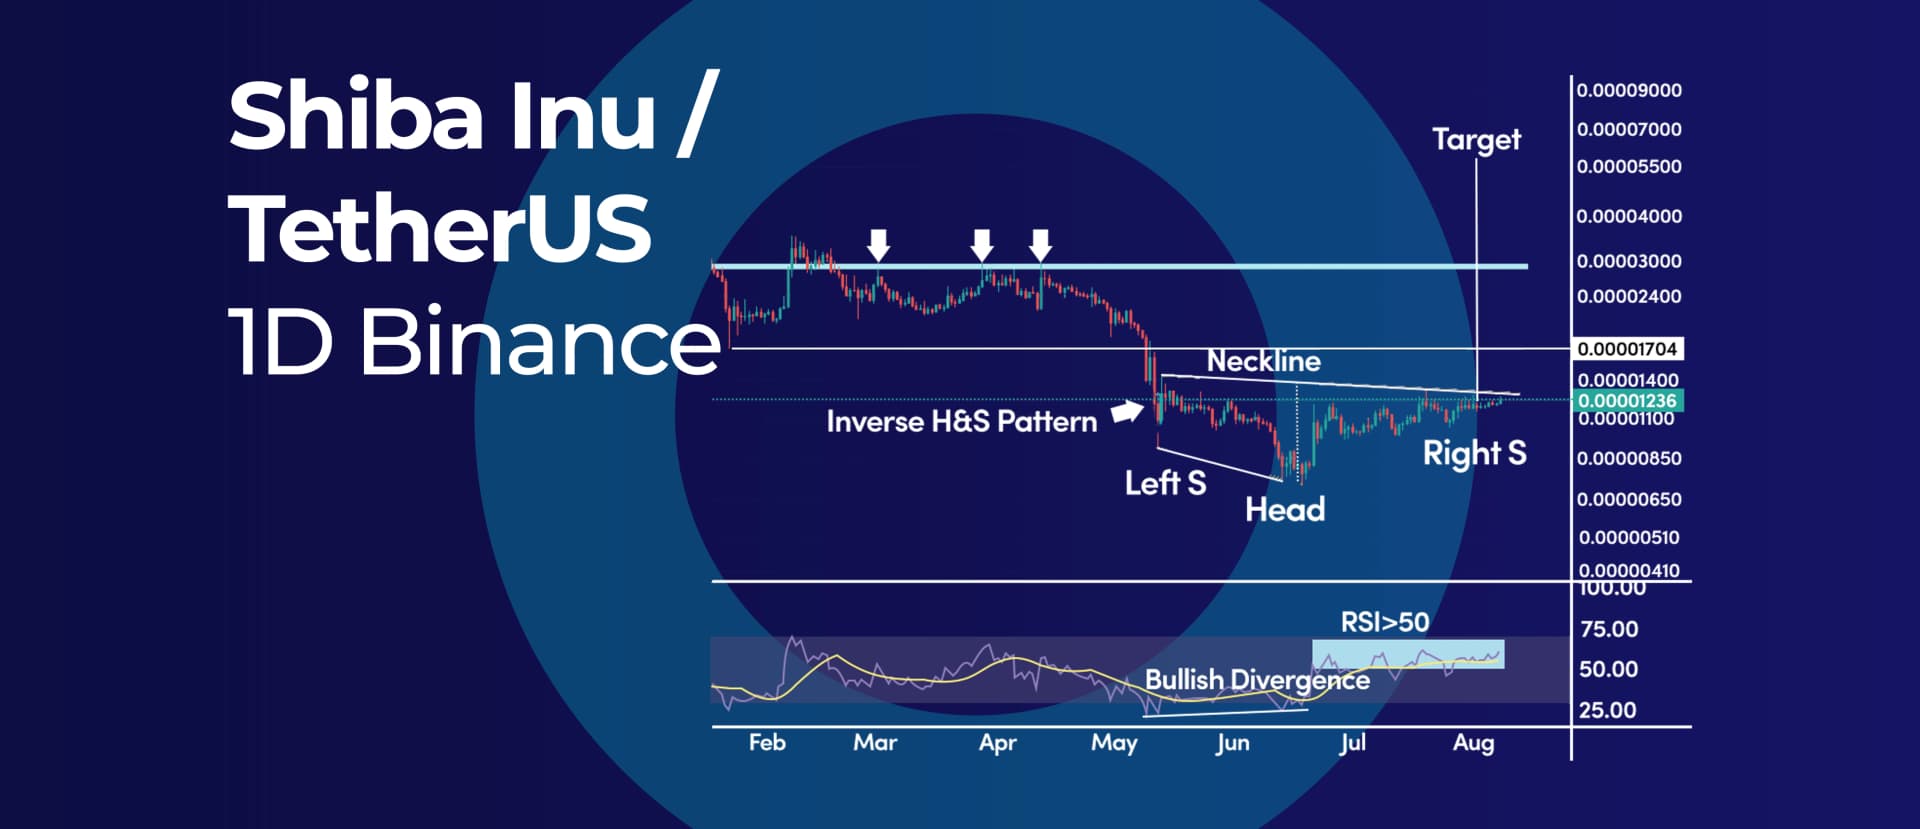
Shiba Inu’s (SHIB) daily chart depicts an almost perfect inverse head and shoulder pattern that calls for a rally towards $0.000025. Additionally, the daily RSI oscillator seems to be building momentum as most RSI readings are above the 50 mid-level.
Inverse Head and Shoulder Pattern
The left shoulder ended with the $0.000009 swing low, and down from there, the head finished at $0.0000071. The right shoulder can be called completed at the $0.000010 low.
Currently, the SHIB price is flirting with the neckline, while a break above will confirm the inverse head and shoulder pattern.
There is also a bullish divergence between the left shoulder and the head, adding more confluence to the bullish case scenario.
If the bullish scenario materializes, the standard target of the Head and Shoulder pattern is the price distance between the head and the neckline added to the breakout point. At the time being, the Head and Shoulder projected target falls at the $0.000025 level.
What is a Inverse Head and Shoulder Pattern?
A Inverse Head and Shoulder Pattern is a technical indicator that is used to identify potential reversals in a security's price.
The pattern is created when the security's price forms two lower highs and a higher low. This creates a "head and shoulders" appearance on the security's price chart.
The neckline is created by connecting the lows of the two shoulders. A breakout above the neckline signals that the security's price is likely to continue moving higher.
RSI Indicator
The Relative Strength Index (RSI) oscillator has been holding up above the 50 mid-level the entire time we have developed the left shoulder, building up the bullish momentum.
If the bulls hold above the neckline, the RSI oscillator can help us confirm the move if the momentum reading holds above the 50 mid-level.
Looking forward: Above the neckline, the first level of interest is the mid-January swing low of $0.000017, followed by the resistance zone near $0.000030.
Would you like to know more about Meme coins like Shiba Inu? Read the blog The Potential Future of Meme Coins in 2022 here.
_webp.webp&w=1920&q=75)
_webp.webp&w=1920&q=75)