
Dive into our guide on essential technical indicators for crypto trading. Learn about MACD, SMA, Bollinger Bands, and more to enhance your trading strategy.
**The details:**Technical analysis is a method used by traders worldwide to predict where the market might be heading.
They do this by studying charts, patterns, and various technical indicators to make informed decisions about buying or selling assets like cryptocurrencies. It's like trying to read the signs and signals in the crypto world to make smart trading choices.
So, if you're thinking about trading crypto, understanding technical analysis can be a helpful tool in your toolkit.
What are technical indicators and how do they influence the price?
Technical indicators are like tools that help traders make sense of price data. They use math to analyze how the price of an asset is behaving. These calculations are then shown on a chart, which makes it easier for traders to understand what's going on with the price.
It's kind of like having a set of tools to help you better understand the crypto market and make more informed decisions when trading. So, if you're into crypto trading, knowing how these indicators work can be pretty handy for you.
These indicators can be grouped into four categories: volume, momentum, trend and volatility. You can choose the ones that work best for your trading strategy.
You might be wondering, why do these indicators work? Well, it's partly because of something called the "self-fulfilling prophecy." This means that when many traders believe a certain prediction, their actions can actually make it come true.
So, these indicators can be accurate because they influence how people trade based on their expectations.
Now, imagine this scenario: if many traders think the price will go up after a bullish Simple Moving Average ( SMA) crossover, they start buying more.
This collective belief and action can actually drive the price higher, making their prediction come true. It's like a self-fulfilling prophecy in action.
To make the most of this, you need to choose the right indicators. Picking the ones that suit your strategy can significantly improve your chances of success.
The 5 most used technical indicators
Moving Average Convergence Divergence (MACD)
The MACD (Moving Average Convergence/Divergence) is a widely popular indicator in trading because it combines both trend and momentum analysis. It's essential to understand how it works to make informed trading decisions.
The MACD (Moving Average Convergence/Divergence) indicator is calculated using two Exponential Moving Averages (EMAs), one with a 26-candle period and another with a 12-candle period.
The MACD line is derived by subtracting the 26-candle EMA from the 12-candle EMA. Additionally, there's a signal line, which is a 9-candle EMA of the MACD line. Understanding these components helps you interpret MACD signals effectively.
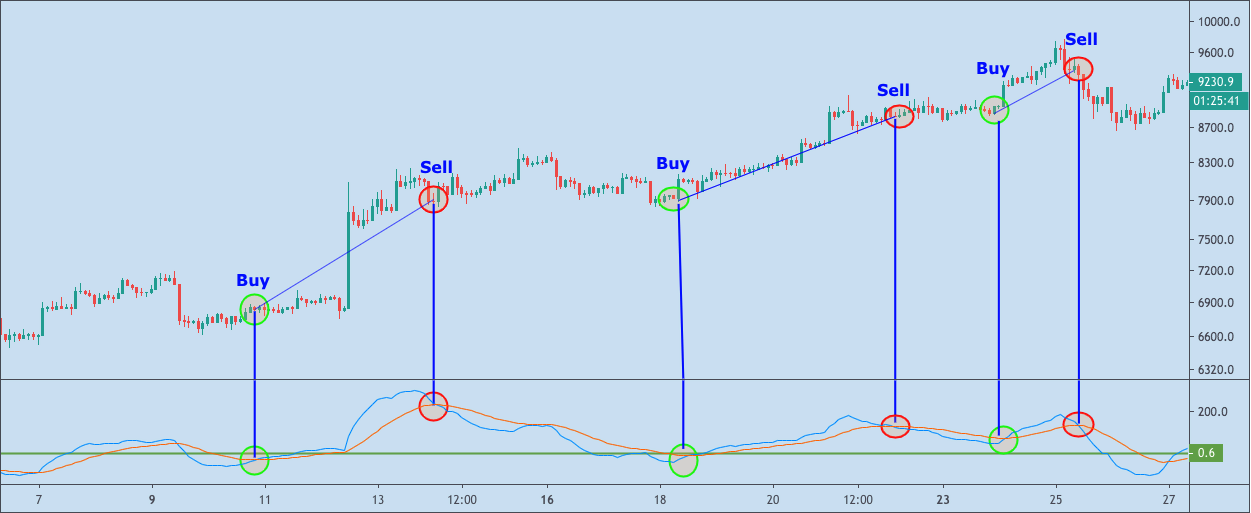
The MACD (Moving Average Convergence/Divergence) indicator is a valuable tool for predicting trend reversals and trading in both upward and downward market trends. You can use the MACD in two primary ways:
- MACD crossovers
These crossovers occur when the signal line and MACD line intersect, creating buy and sell signals in the process. This can help you make informed trading decisions.
A bullish signal happens when the MACD line crosses the signal line upward, indicating a potential price reversal or retracement upwards.
Conversely, a bearish signal occurs when the MACD line crosses the signal line downward, suggesting the opposite – a potential downward movement in price.
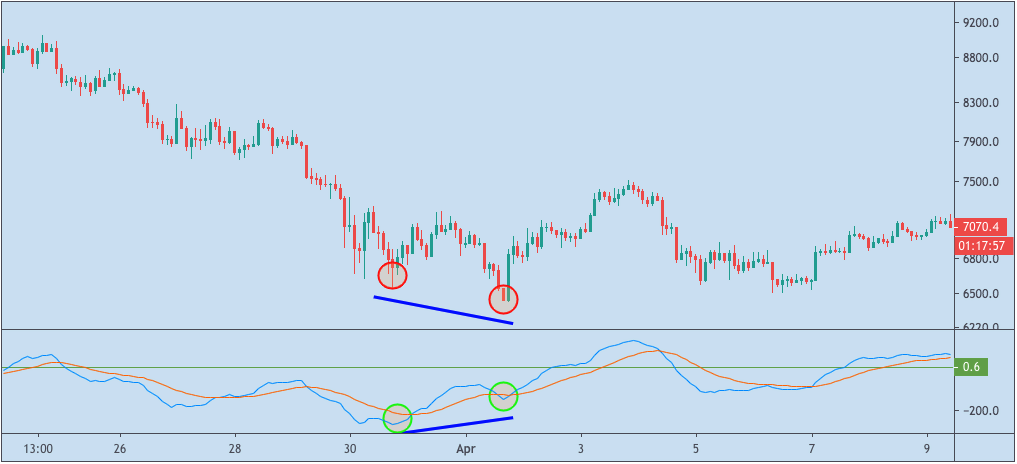
- MACD divergences
This can be especially useful for identifying the potential end of a bullish or bearish trend.
For instance, if you notice the price is continually trending downward, but the MACD line starts moving upward during this decline, it can signal that the ongoing downward trend may be coming to an end.
This could be an indication of a potential trend reversal, presenting a trading opportunity.
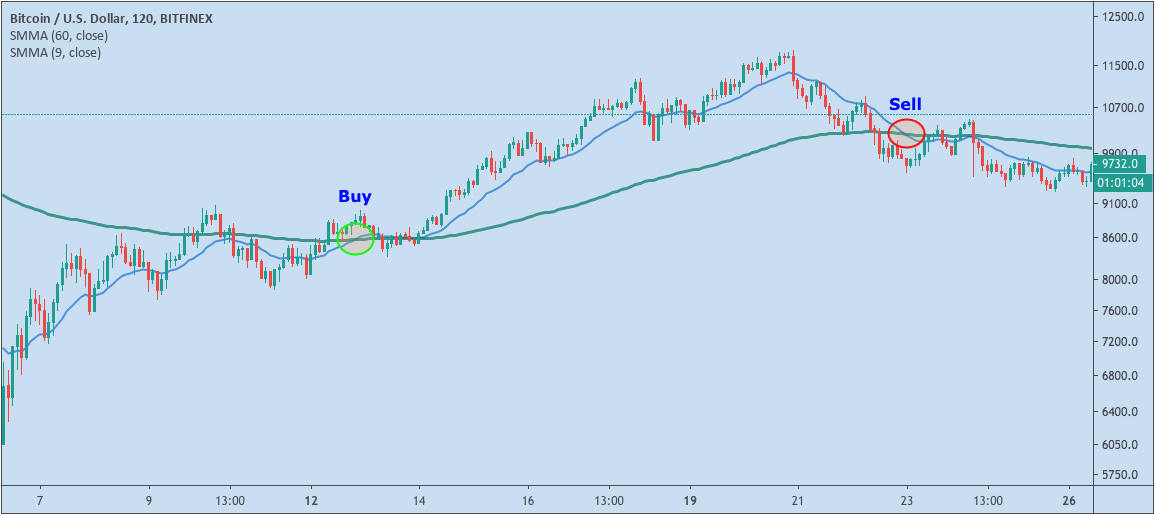
Simple Moving Average
The SMA (Simple Moving Average) is a handy tool for traders like you. It filters out the noise in price movements and offers a clearer view of an asset's trend direction. This basic moving average calculates the average price over a specific number of candles or periods, helping you make more informed trading decisions.
Many traders like you often use the SMA (Simple Moving Average) to make trading decisions. It's particularly helpful for identifying potential entry and exit points through moving average crossovers.
Additionally, it assists in recognizing support and resistance levels across various time frames, making it a valuable tool in your trading toolkit.
When the fast Simple Moving Average (SMA) crosses above the slow SMA, it often indicates a potential trend reversal or correction, signaling a buying opportunity.
If the fast SMA crosses below the slow SMA, it can be seen as a sell signal.
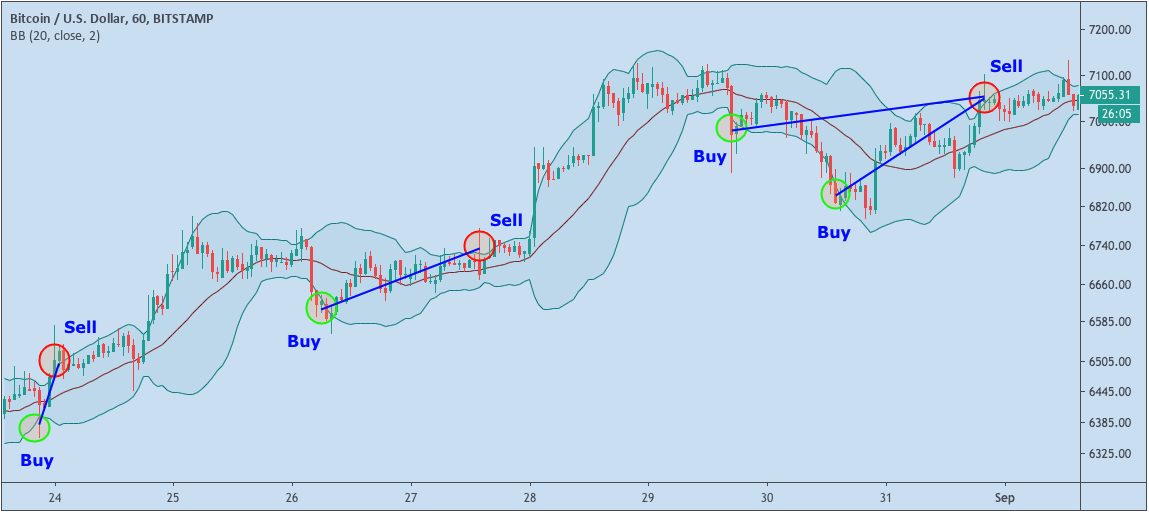
Bollinger Bands
Bollinger bands are widely used to gauge market volatility. It consists of three lines: a center line, which is a simple moving average, and two outer lines representing the lower and upper standard deviations. When market volatility increases, the bands expand, and during less volatile times, they narrow. Understanding Bollinger Bands can help you assess market volatility more effectively.
The Bollinger bands provide buys and sell points through crossovers of the price with the upper or lower band. When the price breaks the lower band, it is interpreted as a buy signal. On the other hand, if the price breaks the upper one, it will be a sell.
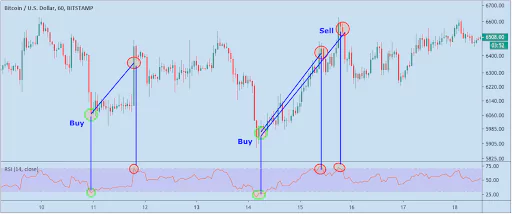
Relative Strength Index (RSI)
The RSI (Relative Strength Index) is a momentum indicator that helps assess market sentiment. When the RSI is rising, it indicates bullish momentum, while a declining RSI suggests bearish momentum. Understanding these RSI movements can assist you in gauging market trends and making informed trading decisions.
The RSI is a versatile indicator that you can apply to various trading styles and objectives. You can use it to identify overbought and oversold conditions in the market, helping you make decisions about buying or selling assets.
Overbought zones are areas where the price has risen a lot in a small interval of time. Therefore, it considers that the asset is likely to have a bearish trend reversal or correction and the RSI will signal a sell. On the other hand, oversold zones are the opposite and are interpreted as buy signals.
Volume
Volume is a straightforward yet crucial indicator for traders. It doesn't provide buy or sell signals like some other indicators, nor does it involve complex calculations.
Instead, volume tells you how much of a particular currency, asset, or cryptocurrency has been traded in a specific time frame.
So...if volume doesn't give a buy or sell signal, why should you use it?
Volume acts as the engine driving price movements, and it holds valuable insights into price behavior. By understanding and analyzing volume effectively, you can gain valuable hints about where prices might be headed in the future. This makes volume an essential aspect to consider in your trading strategy.
Indicators that take into account volume in their calculations like the OBV, Money Flow Index and Chaikin A/D Oscillator can help you to find buy and sell points.
Bottom line
Technical indicators are a great tool for you can use. They display important information in the chart, so you can quickly get a good idea of which context you are trading in.
Creating strategies based totally or partially on indicators can provide you with good entry and exit points. You can even automate this process with Cryptohopper to avoid certain issues that can sabotage your strategies like emotions and overtrading.


_webp.webp&w=1920&q=75)
_webp.webp&w=1920&q=75)