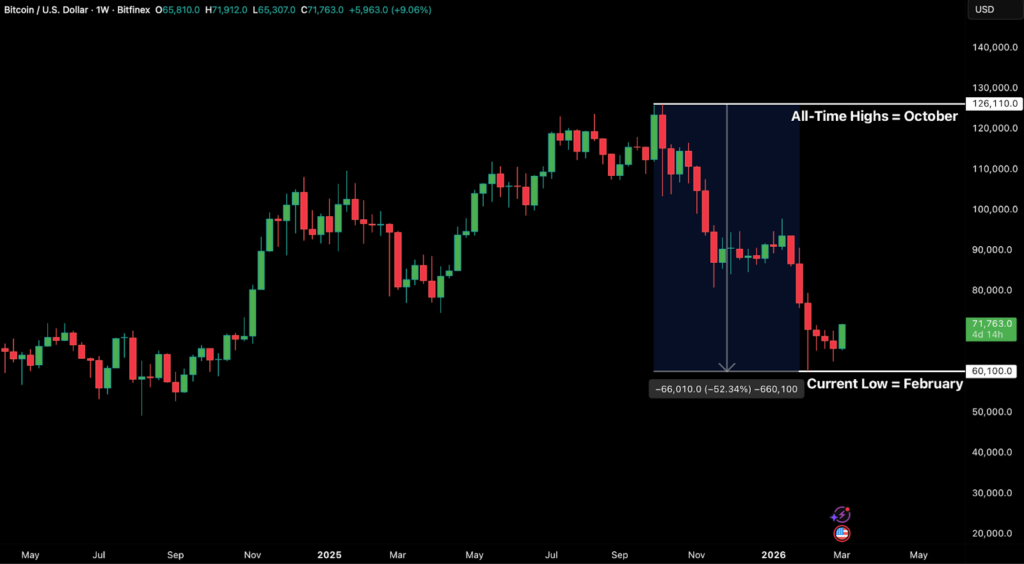
Since the 2018 bear market, bitcoin has not recorded five consecutive monthly red closes. Until now, as the market enters March 2026.
The current streak began in October 2025 and culminated with a 14.93 percent decline in February 2026, bringing the total peak-to-trough drawdown to roughly 52.34 percent. Such an extended run of negative monthly performance highlights a prolonged phase of distribution, deleveraging, and weakening market sentiment.
This sequence of sustained declines is an exceptionally rare structural event and underscores the severity of the ongoing correction.
Since this weekend’s geopolitical turbulence, there has been a notable increase in spot market strength and we consider there to be a possibility of relief over the coming weeks and months should this trend follow through.
There is notable aggression from spot market participants bidding BTC higher since 1 March. Aggregated across exchanges, a total of $3.2 billion has been market-bought in a systemic manner during late Asia and US sessions, running counter to the trend observed over the preceding weeks and months.
The BTC/USD reclaim of the $65,000 level signals the transition into a “wall of worry” expansion.
Open interest (OI) is building at a 1:1 ratio with spot, indicating an absence of speculative froth.
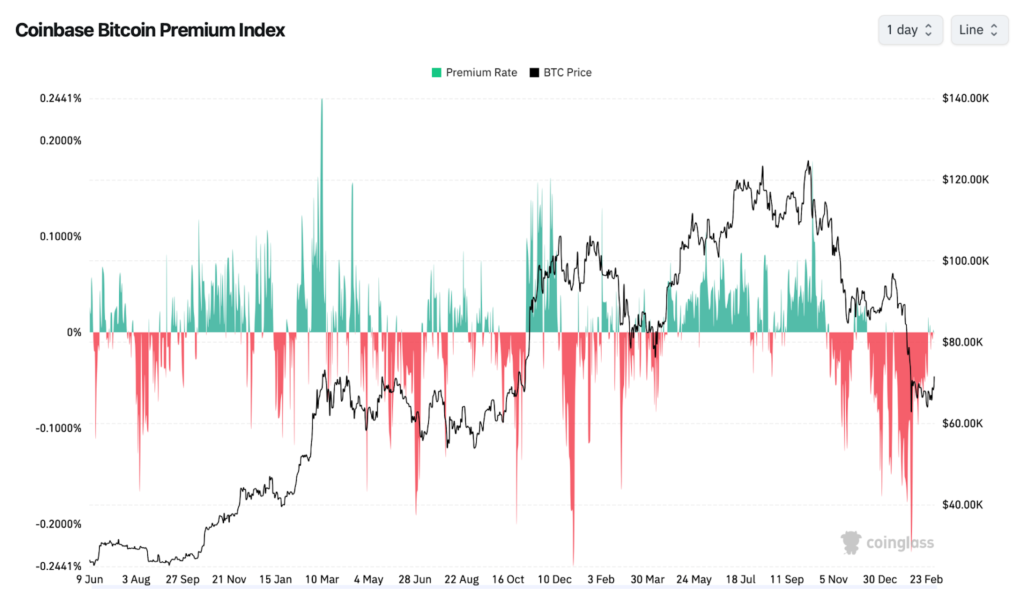
The 40-day negative streak on the Coinbase Premium has ended, with a consistent +0.03 percent spread confirming the persistence of US-side buying.
Following the resilient defence of the $60,000 floor, the market has transitioned into a definitive expansion regime. Our derivatives-first framework suggests this move is fundamentally healthy:
- Derivatives Architecture: BTC open interest (OI) has risen to $53.1 billion, a 15.4 percent increase since the Sunday close. Crucially, perpetual funding rates remain moderate at 9.5 percent APR, well below the 15–20 percent threshold that typically signals an overheated long bias.
- ETF Continuity: The strength in spot markets was underscored by last week’s three-day reversal in US spot bitcoin ETF flows, which totalled $1.1 billion. Should key support levels hold, there is a reasonable probability of a fragile recovery toward the $80,000–$85,000 range over the next one to three months, contingent on the stabilisation of global energy costs and a successful reclaim of the True Market Mean at $78,200.
The $1.1 billion reversal from late February has not been a single-print event. Monday and Tuesday combined for over $450 million in net inflows, confirming that institutional spot appetite remains the primary price driver.
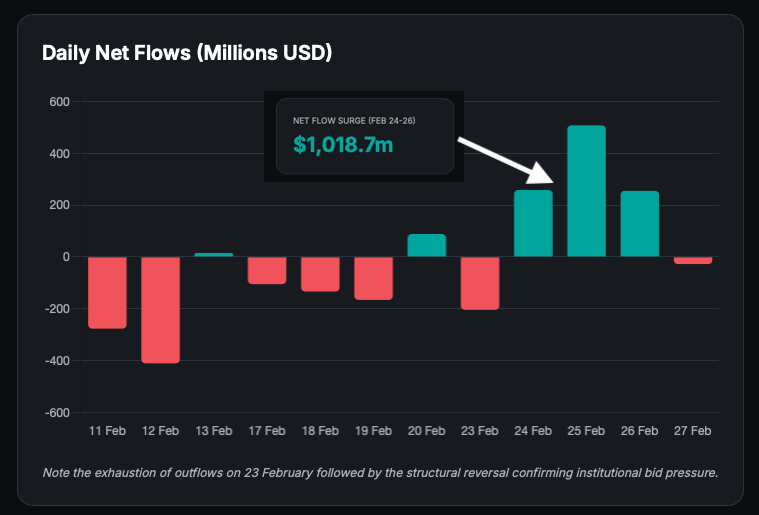
- Spot Absorption: The positive flip in the Coinbase Premium Index has held for 72 hours. This, combined with active spot bidding for BTC on Bitfinex, indicates that the current rally is driven by unleveraged accumulation rather than speculative liquidation.
Key Anchors For Price
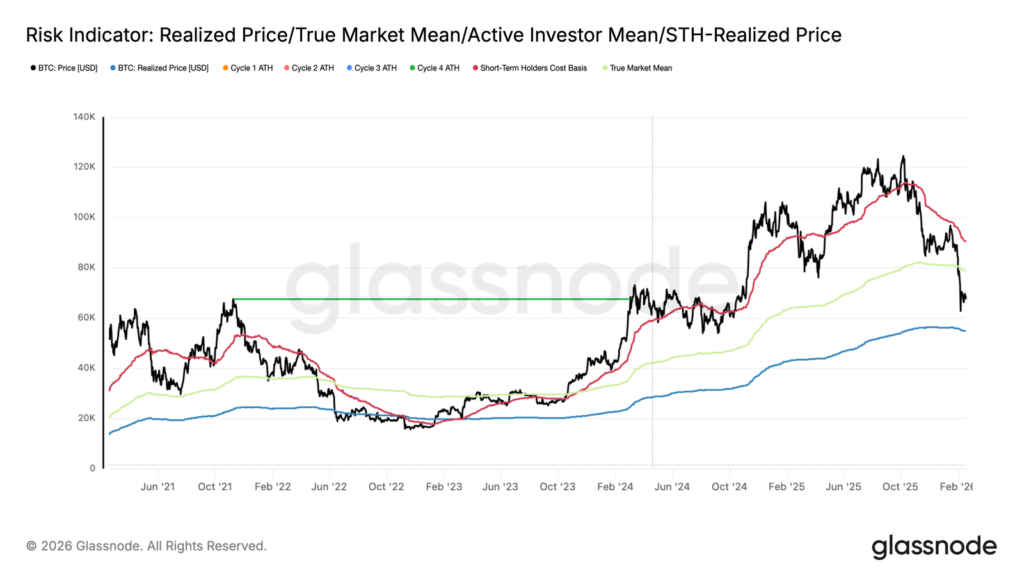
In prior cycles, two valuation anchors have framed extended periods of compression and absorption. In the absence of an immediate macro catalyst, the $78,000 True Market Mean, which we expect to be reached first given price resilience during the current period of geopolitical tension, and the $53,000 Realised Price are likely to define the primary resistance and support levels for mid-term market structure.
There are several key questions to consider going forward:
- Macro Pivot: Given the elevated PPI print referenced in the slides, will there be any meaningful breakdown in the bitcoin–Nasdaq correlation (currently 0.52) as yields climb?
- Options Wall: With the 27 March quarterly expiry approaching, will there be any aggressive gamma hedging activity near the $72,000 strike that might act as a temporary ceiling?
- Hormuz Monitoring: Has the geopolitical situation in the Strait of Hormuz stabilised sufficiently to reduce the probability of a bearish extension further — given the current strength in spot markets and ETF flows?
Since bitcoin has remained surprisingly resilient in spite of geopolitical turmoil affecting all economies, we must examine liquidation levels specially, particularly high-leverage concentrations hence to identify likely support and resistance levels should volatility return.
Higher-leverage clusters are generally prone to sharper liquidations within concentrated price regions, and it is therefore important to study where these clusters sit.
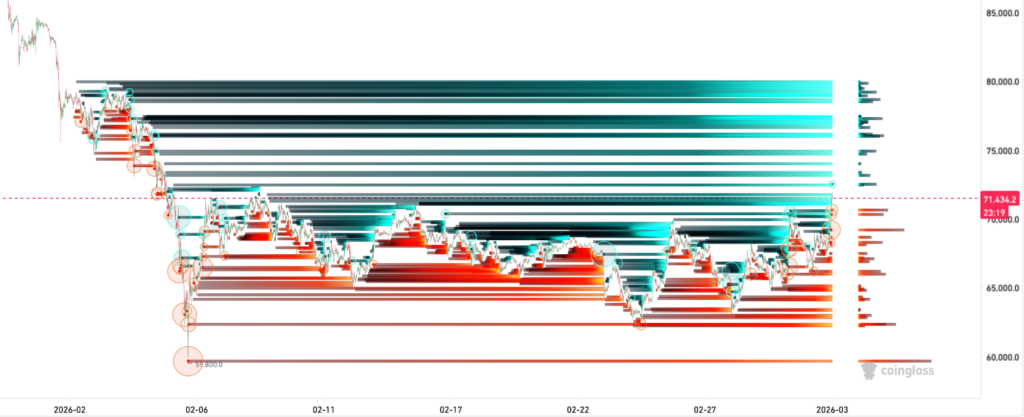
Following the volatile move down from $73,000 to $64,000, the data is now flagging the $72,000–$74,000 zone as the densest short-liquidation wall on the multi-week structure.
We remain cautiously bullish in the near term; a significant volume of leveraged long positions is opening, and should a sharp drop occur, we expect $66,000 to hold as dynamic support with substantial buy-side interest anticipated at that level if price were to reach it.
The post appeared first on Bitfinex blog.