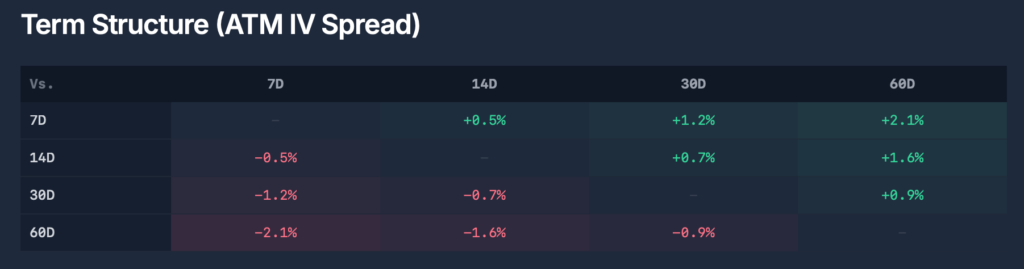
Bitcoin is holding its range, but that range is below the gamma flip, with aggregate market maker exposure now negative rather than positive. In this regime, dealer hedging amplifies moves rather than dampening them. Friday’s $10.6 billion quarterly expiry is where that positioning resets.
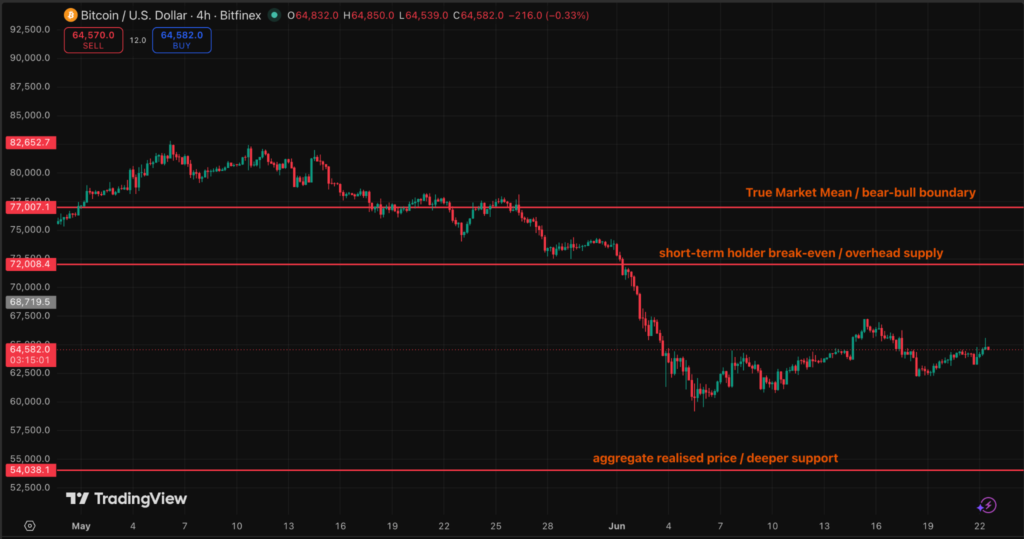
- Bitcoin held the $62,500-72,000 range we named in issue 210 of Bitfinex Alpha, published on 22 June, with positions now coiling well within the lower half of that range.
- BTC is now trading below its gamma flip at approximately $68-70,000, as net dealer gamma goes negative. Hedging adds to moves instead of fading them, but we see this range as a coil, not a ceiling.
- The asymmetry is to the downside. A sustained move below the $60,000 put wall pushes deeper into negative gamma and risks a cascade toward $54,000 to $56,000 near the Realised Price. An upside squeeze into $66,000 to $68,000 is capped by offers and the flip above.
- Friday’s $10.6 billion quarterly options expiry, 80 percent out of the money, resets the walls. The macro and flow lean is lower; the structural floor leans the other way.
Key Levels at a Glance
Level
Read into Friday’s expiry
Spot (24 June)
Low $60,000s, drifting toward the put wall
Gamma flip
$68-70,000. Spot is well below it, so the regime is negative gamma
Put wall
$60,000 ($450m of 26 June puts). Support that inverts on a break
Call wall
$80,000 ($406m). Far overhead; not in play near-term
Max pain
$74,000. Inert while price is below the flip, no pinning force
Range
$60,000 floor / $68,266 quarterly-open ceiling
Cycle low
$59,200 (5 June), intact through three range low tests
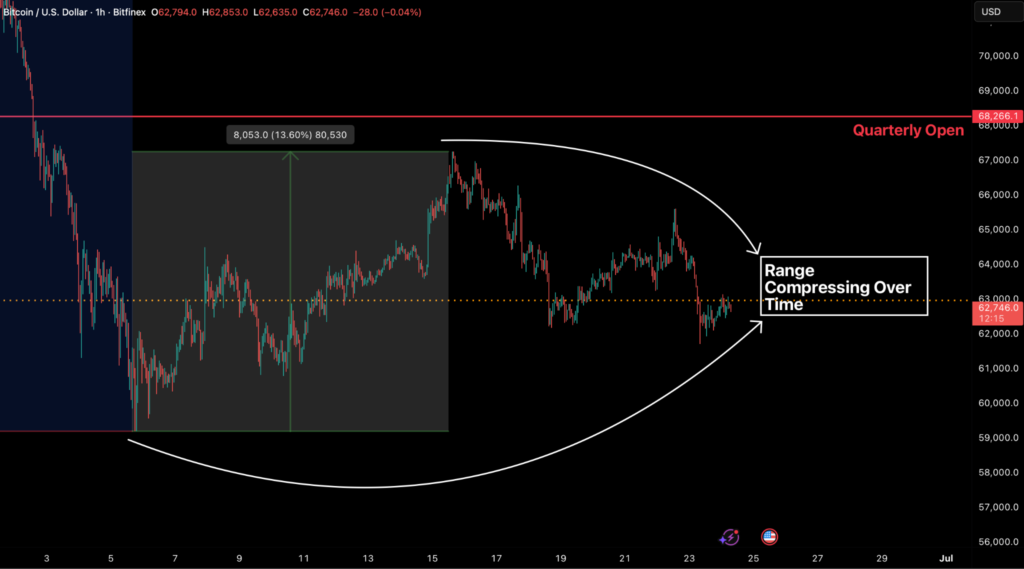
Options Regime Continues to Coil
As projected in our previous outlook, BTC has continued to consolidate within the defined $62,500-72,000 range and more so within the lower half of the range. Despite brief intraday strength reclaiming $65,500 on 22 June, momentum faded, resulting in a retracement below $62,000 and subsequent compression within even tighter bounds. With both the established floor and the $68,266 quarterly-open ceiling remaining intact, current price action has become secondary.
The primary narrative now lies in the underlying options architecture, which dictates the mechanics for an eventual breakout.
What the Gamma Profile Is Actually Telling Us
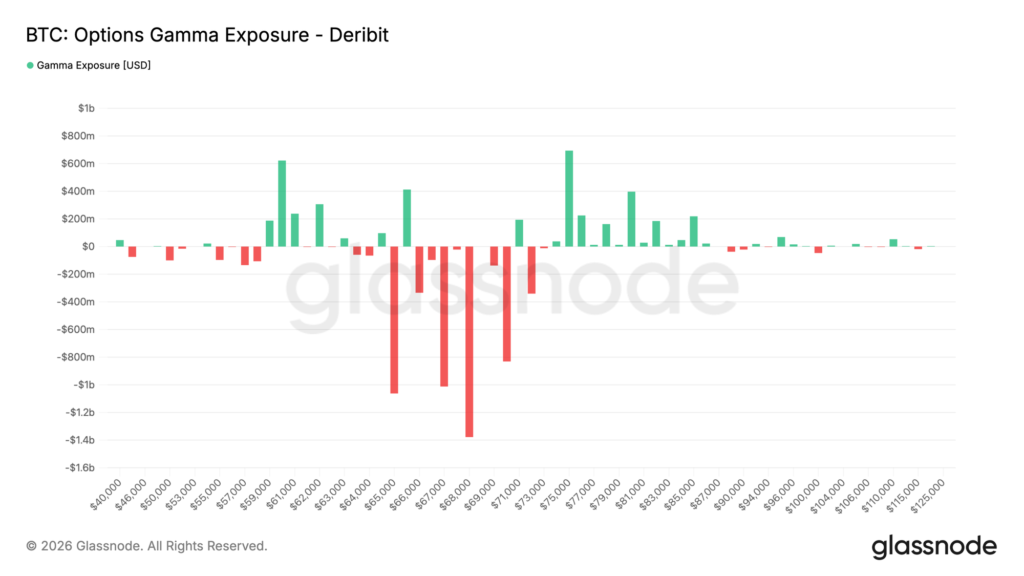
The sign of dealer gamma decides how price moves, not where. Gamma exposure measures how much options market makers must buy or sell to stay hedged for each move in spot. The entire market has net negative gamma at the moment at -143,000 BTC. When dealers are net long gamma they hedge against the move, selling rallies and buying dips, which suppresses volatility and pins price toward large strikes. When they are net short gamma (as is the case right now) they hedge with the move, buying as it rises and selling as it falls, which amplifies volatility and turns drifts into trends.
The price that separates the two states is the gamma flip, the level where net dealer gamma crosses from positive to negative. It is the single most important number on the surface, because it tells you what regime we are in, rather than the direction of price.
Options order flow has achieved a tentative equilibrium. Put demand commanded a leading 28.1 percent share of traded premium over the last seven days, though call accumulation followed closely at 24.1 percent. The last 24 hours indicate a marginal tilt toward calls as the dominant flow, suggesting price compression within the range could continue near-term.
The surface architecture reflects this shift. The most significant short-gamma concentration is now anchored at $68,000. With spot currently hovering near $62,000, BTC is pinned beneath the heaviest amplifying dealer positioning.
As hedge demand stabilises, the primary negative-gamma cluster persists above spot near $68,000, maintaining the dealer-amplified regime.
At -5.2 percent, the put skew has climbed noticeably north of its -6.0 percent historical mean. The higher the put skew, the more defensive positioning is signalling a willingness to pay more for downside protection than upside exposure. Overall, the put skew indicates a regime of elevated defensive anxiety.
Bitcoin is currently trading below its gamma flip, placing the entire observed $60,000–$68,266 range within negative-gamma territory. Positive dealer gamma is isolated to the high $70,000s, centred near the $77,200 True Market Mean. This configuration clarifies market behaviour: the current compression is not a function of a long-gamma book pinning the price. It’s the quiet before a potential catalyst within a short-gamma structure.
Moves will amplify in either direction while price is confined to the negative-gamma range. Any potential breakouts from these levels could trigger volatile continuation moves in the same direction.
Friday’s Quarterly Expiry Brings a Regime Reset
The 26 June options expiry is the largest of 2026 to date, at $10.6 billion of open interest, with about 80 percent out of the money. The headline number most desks will quote is max pain at $74,000, but that level is a distraction here. Max pain pulls price only when dealers are long gamma and hedge toward it, and Bitcoin is below the flip, so $74,000 has no gravity.
The expiry matters because it brings a reset of the positioning that has shaped the range.
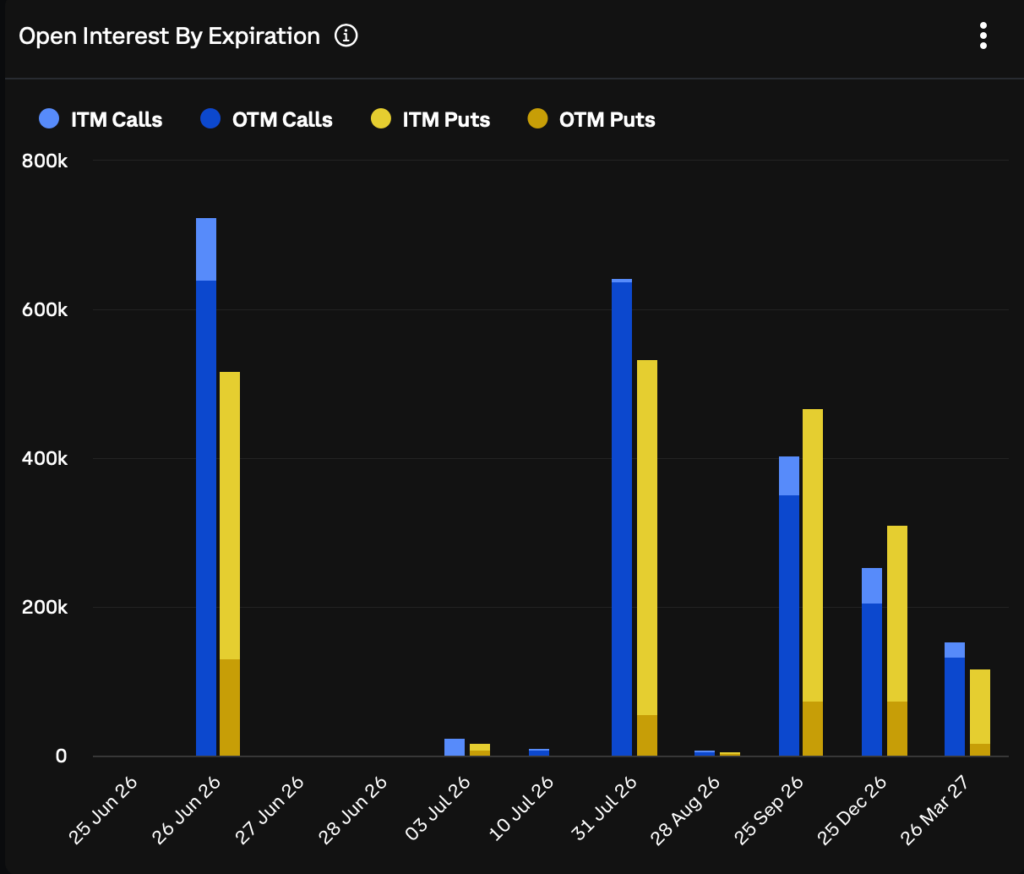
At settlement, the out-of-the-money strikes expire worthless and the gamma they contribute vanishes, including the $60,000 put wall that has anchored the floor and the strikes that capped the top. The dealer book then re-forms around new front-month contracts struck near wherever spot is trading. And then, two things follow.
First, clearing a large short-gamma expiry tends to release the forced hedging that has been muting the tape, so the days after a quarterly are where ranges most often resolve rather than persist. Second, the options-based floor at $60,000 disappears, and whether a new one forms depends entirely on whether participants buy fresh downside protection below spot in the days after expiry. If they do not, $60,000 has to be defended by spot demand alone.
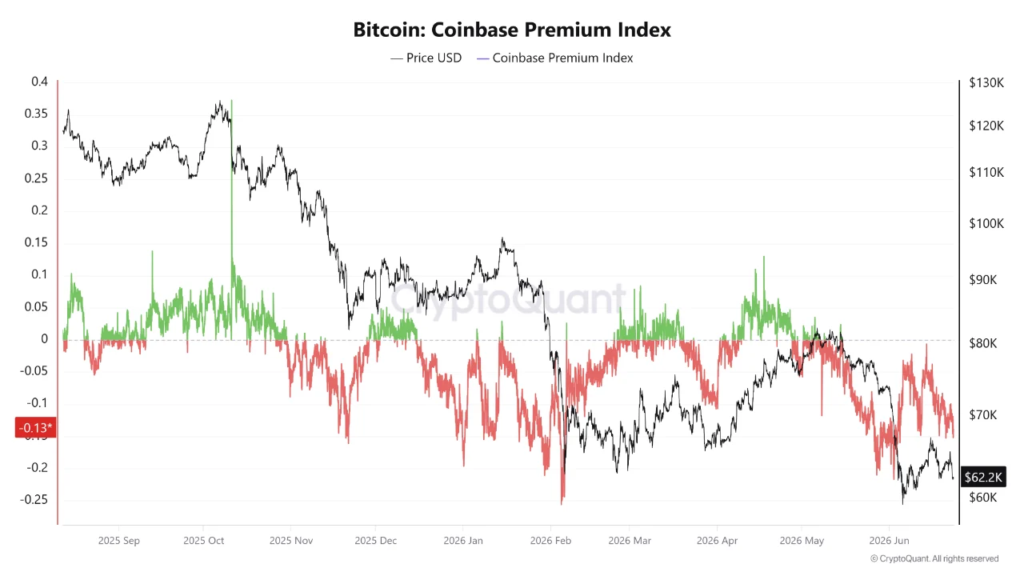
These options dynamics have continued to prevail at a time when the spot market has seen faltering aggressiveness in demand. The Coinbase premium index, typically representative of taker demand via Exchange Traded Funds (ETF) and treasury companies, continues to trade heavily in the negative territory. That makes the case for a fragile market held up by passive flows amid thin liquidity and weak taker flows.

The post appeared first on Bitfinex blog.