_webp.webp&w=1920&q=75)
Dogecoin has defied expectations before, rising from meme status to deliver massive returns during previous bull markets. With renewed attention on technical patterns, social media influence, and broader market conditions, analysts are once again eyeing DOGE as a potential breakout candidate.
TLDR Dogecoin’s two major rallies—in 2017 (from $0.0002 to $0.0187) and 2021 (from $0.0038 to $0.73)—followed similar parabolic two-phase patterns driven by social-media hype, Elon Musk endorsements, and Bitcoin’s wider bull markets. Today, repeating RSI breakouts, moving-average setups, and triangle breakouts hint at a potential new run, but DOGE’s high market cap and reliance on external factors—BTC’s performance, regulatory shifts, and viral memes—mean gains are likely to be more modest than past 8,000–23,000% surges. Trade cautiously, weighing technical signals against valuation and broader market dynamics.
Dogecoin’s journey from a lighthearted meme to a market-moving asset has been highlighted by two monumental bull runs—in 2017 and 2021—that saw meteoric price surges driven by technical patterns, social media mania, and broader crypto market dynamics.
In 2017, DOGE exploded from $0.00023 to an ATH of $0.0187, an 8,200% increase, as retail enthusiasm and meme culture converged with the wider altcoin boom . Four years later, in early 2021, Dogecoin rode the wave of the altseason and Elon Musk endorsements to reach $0.73, fueled by high-profile endorsements, community momentum, and mainstream exchange listings.
Today, historical chart patterns hint at potential repeat performances, with analysts pointing to RSI breakouts, moving average crossovers, and mirrored price formations as precursors to the next explosive rally.
However, you must weigh technical signals against external factors—Bitcoin’s trajectory, regulatory shifts, and ongoing social media influence—to discern risk and opportunity ahead of Dogecoin’s next bull run.
Historical Dogecoin Bull Runs: Patterns and Catalysts
2017 Bull Run
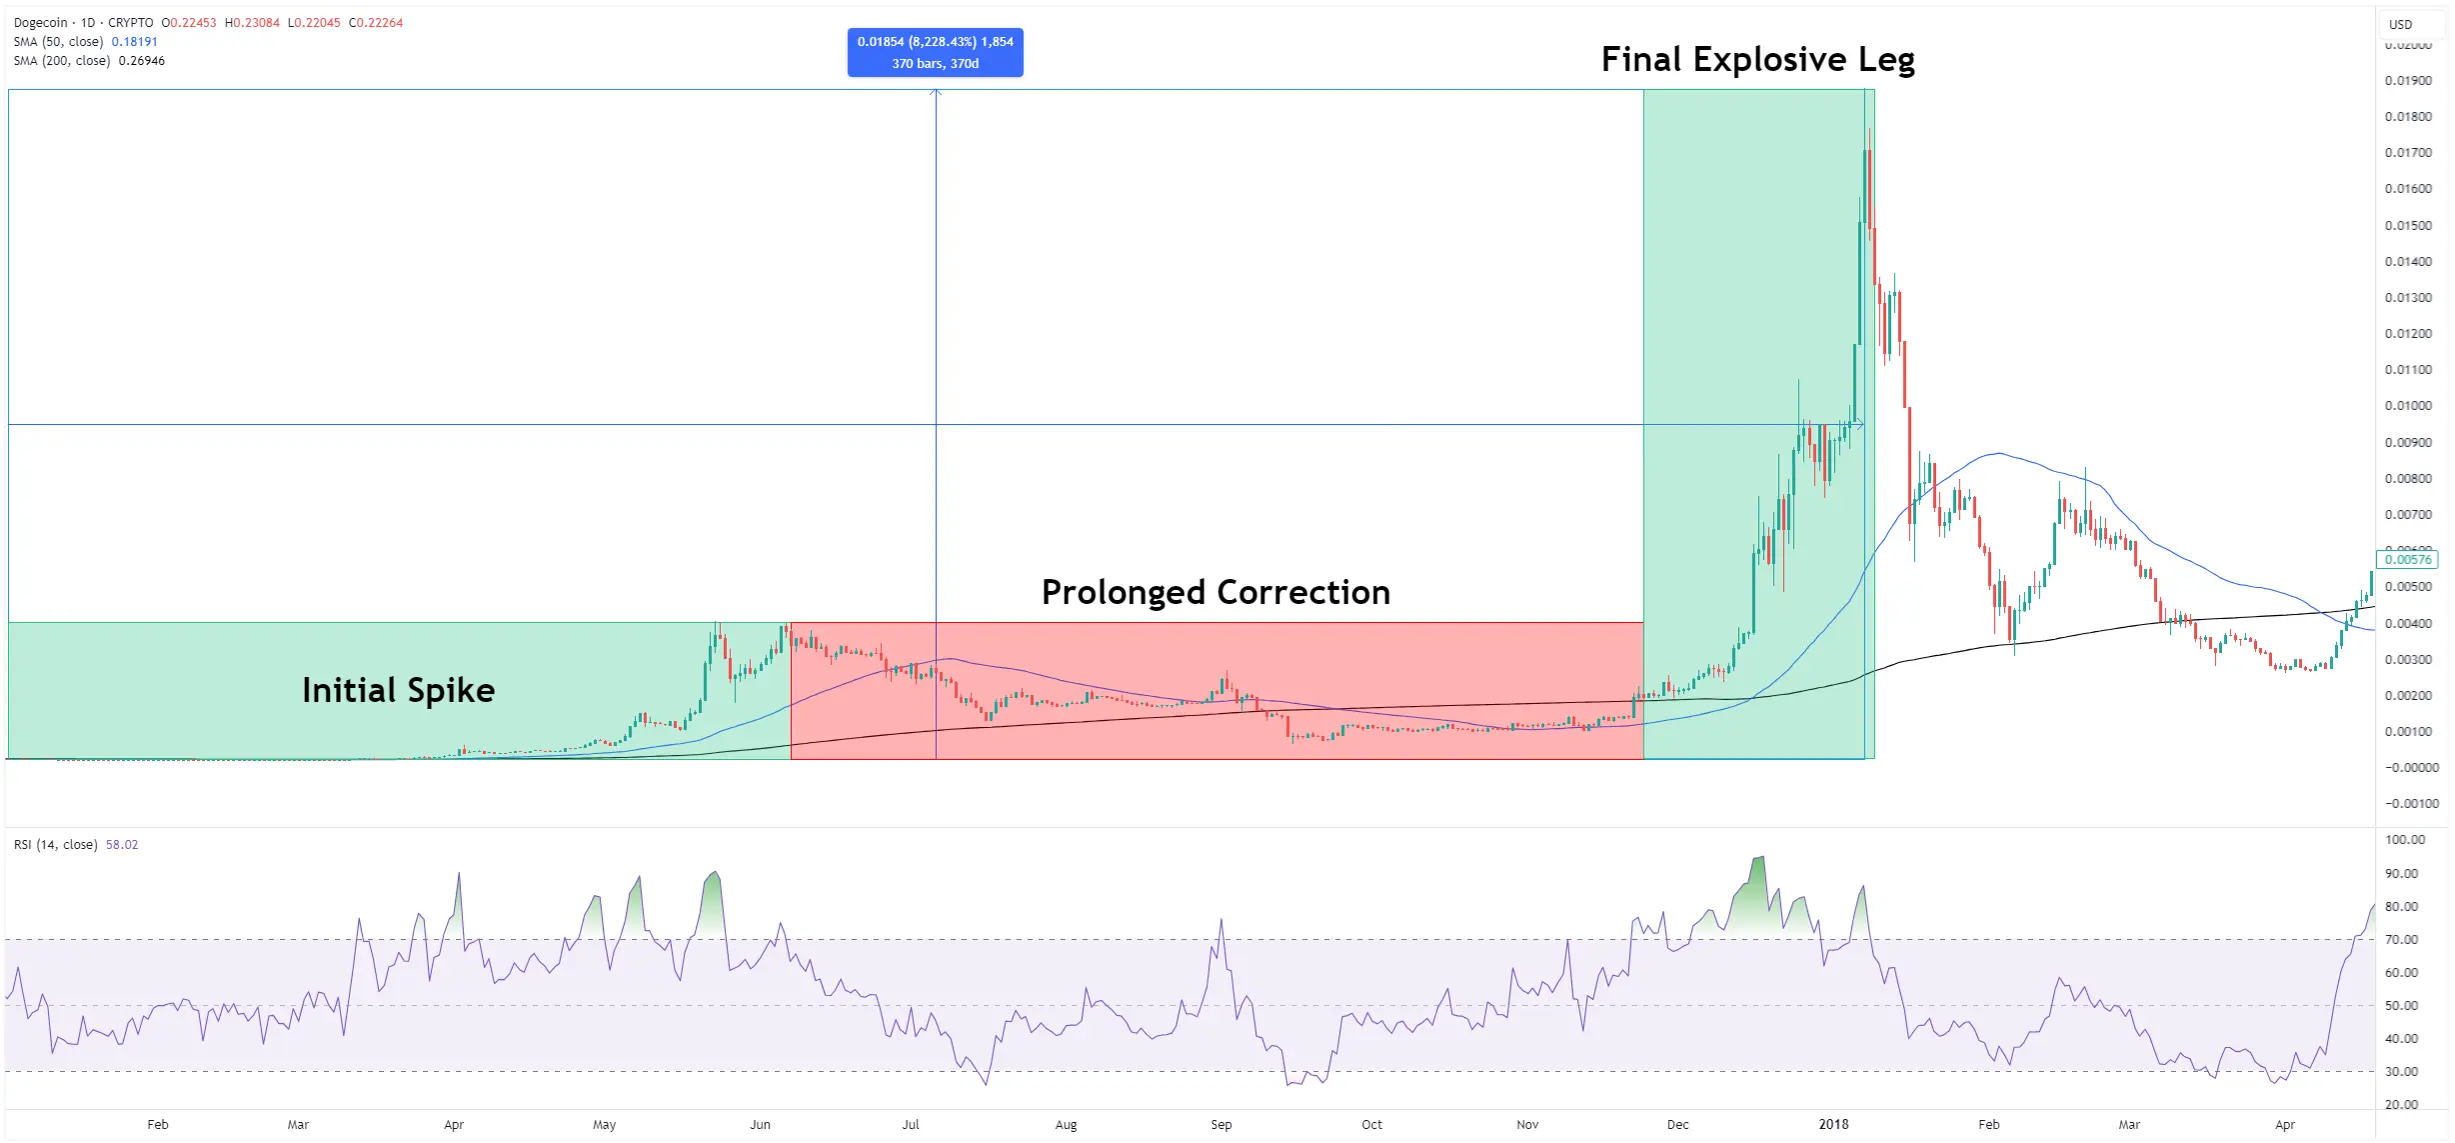
Chart by TradingView
Dogecoin’s first major breakout occurred during the 2017–2018 cryptocurrency supercycle, when the price rocketed from $0.00021 in February 2017 to a peak of $0.0187 in January 2018—an 8,804% gain—driven by FOMO, social media fever on Reddit, and spillover from Bitcoin’s rally.
Technical analysts later noted a two-stage parabolic pattern: an initial spike, a prolonged correction, and a final explosive leg, a structure that crypto pundits believe is now repeating.
2021 Bull Run
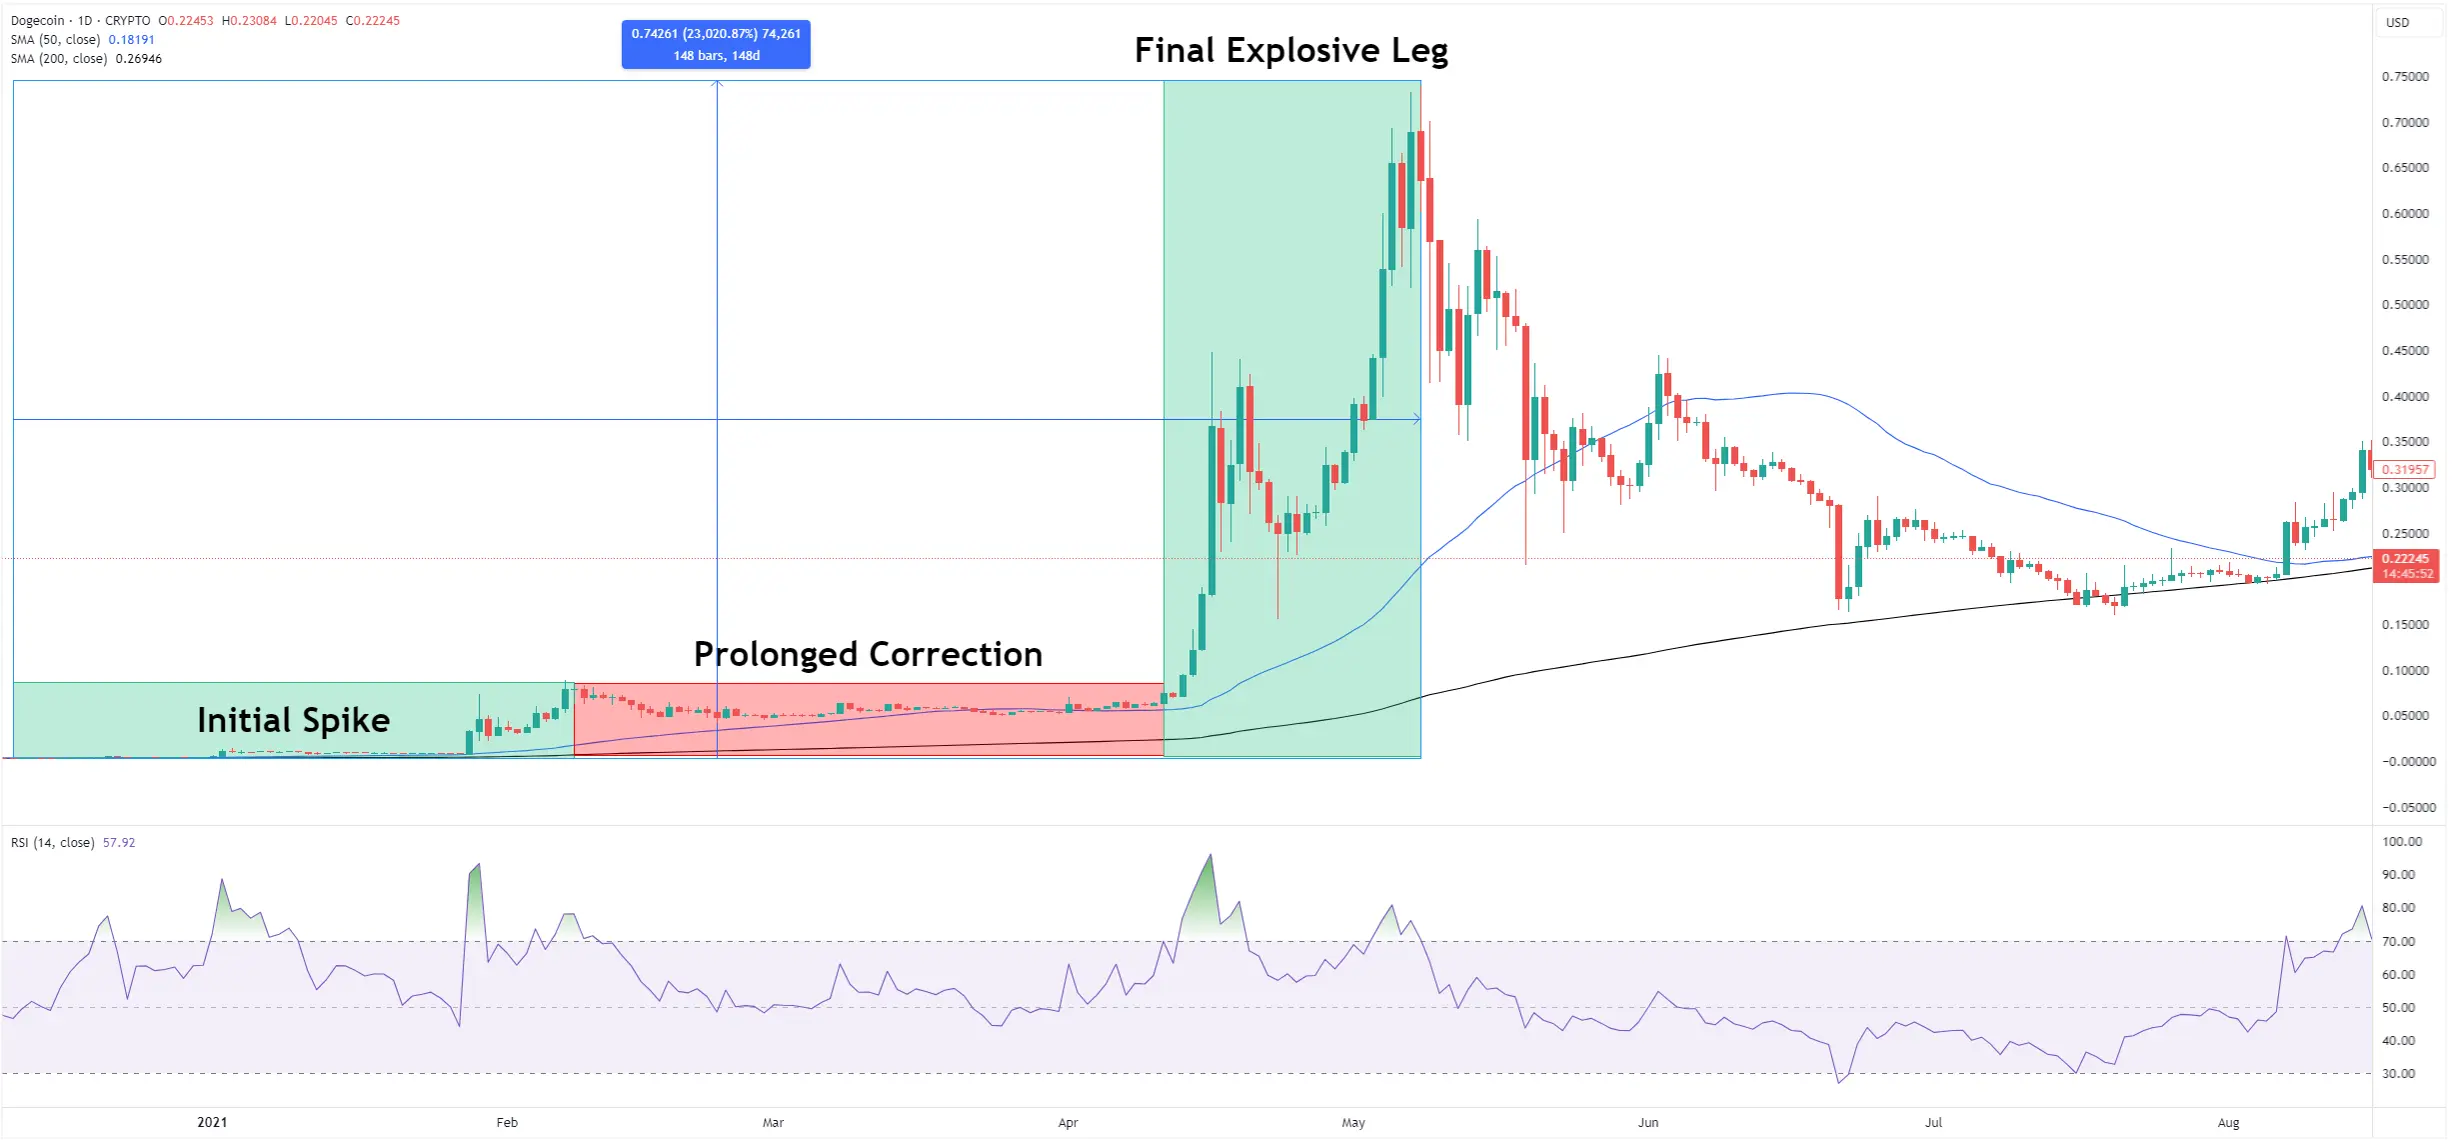
Chart by TradingView
In early 2021, Dogecoin surged again, reaching $0.73 at its ATH amid a confluence of altcoin enthusiasm, high-profile exchange listings (e.g., Coinbase Pro), and relentless promotion by Elon Musk—whose tweets and endorsements repeatedly triggered 10–20% intraday spikes.
Retail traders on platforms like Robinhood and Kraken amplified the move, while meme finance culture—exemplified by r/wallstreetbets—provided a social backbone for collective buying pressure.
Overall the memecoin went from just $0.0038 in December 2020, to $0.73 in May 2021. That is an astonishing 23,000% in just 5 months. So if you had invested $1,000 in Dogecoin in December 2020 and sold at the all-time high, you would have made $230,000, enough to buy an apartment in some parts of the world.
Key Takeaways
- Parabolic, two-phase patterns in both cycles suggest a recurring structural setup.
- Corrections lasting approximately 100–112 days in 2017 preceded equally long pump phases—an observation some analysts expect to echo in 2025’s cycle.
- Social media catalysts and influencer engagement can accelerate technical breakouts into full-blown bull runs.
Technical Indicators Signaling Bullish Trends
Relative Strength Index (RSI)
An RSI reading above 70 often heralds overbought conditions, but sustained RSI levels between 50–70 during consolidation can signal building bullish momentum. Analysts have observed DOGE’s RSI mirroring 2017 patterns, with values holding above 50 for extended periods prior to parabolic price action.
However, the rally usually stops when the RSI is around the 90 overbought level.
Chart Patterns
Chartists highlight triangle breakouts and parallel channel formations as key setups. A confirmed breakout above the descending trendline around $0.185 could mimic the pattern that led to Dogecoin’s 2017 spike, paving the way for targets above $0.20.
Moving Averages
Crossovers such as the 50-day SMA crossing above the 200-day SMA (a “golden cross”) are bullish signals. In April 2025, DOGE trading above its 50-day SMA amid Bitcoin’s rally suggested a potential 90-day bull run.
On the other hand, the 50-day SMA is still well below the 200-day SMA, so the golden cross has not happened yet. However, one must remember, that the golden cross itself is a lagging signal, meaning that the rally has already started, and sometimes, the signal from the golden cross, occurs in the middle of the rally.
External Factors Influencing Bull Runs
Bitcoin Performance
Historically, Dogecoin’s price movements correlate strongly with Bitcoin’s trend. A 30-day correlation coefficient of up to 0.97 means Bitcoin’s ascent toward milestones like $100,000 often pulls DOGE higher, with altcoins “slingshotting” past initial resistance after BTC breaks key levels.
Social Media
Platforms like Twitter (X) and Reddit remain primary catalysts. Elon Musk’s tweets can ignite 10–20% rallies within hours, while TikTok-driven challenges have produced flash spikes (e.g., July 2020’s “#Doge to $1” campaign) . Influencers such as Jeremy (@Jeremyybtc) have also stoked anticipation for new bull runs by claiming Dogecoin’s integration into mainstream economies.
Regulations
Political shifts—such as expectations of lighter crypto regulation under the current U.S. administration—can boost investor confidence. Anticipated policies favoring crypto adoption have been linked to Dogecoin’s recent gains, with Trump-era promises of an “America as a crypto hub” cited as bullish drivers.
Future Projects and Price Predictions
Analysts offer wide-ranging forecasts for Dogecoin’s next bull run. Conservative models based on 2017’s structure predict a surge to $1 in 2025, while more aggressive pattern mirroring suggests potential targets up to $1.5-$2, should DOGE fully replicate its 2017 parabolic phase. Factors underpinning these predictions include:
- Network upgrades (e.g., potential tipbot integrations on X)
- Growing merchant adoption, following Dallas Mavericks’ DOGE-enabled transactions in 2021
- Memecoin resurgence, with projects like PEPE and BONK driving renewed attention to the sector
However, we should also look at market cap. Dogecoin at $0.22 is already at a marketcap of $33 billion. Therefore a growth of 10 times from the current level, is very unlikely, as that would make Dogecoin the second most valuable cryptocurrency on the market (provided the other altcoins do not increase as well).
Bottom Line
Dogecoin’s past bull runs were driven by a mix of technical setups, viral momentum, and market-wide euphoria—fueled by both sentiment and structural cycles. While current indicators and chart formations hint at a possible repeat, caution is essential. External factors like Bitcoin's trajectory, regulatory developments, and the unpredictable force of social media can all influence outcomes.
Though a major rally is possible, exponential gains like those of 2017 and 2021 may be harder to replicate given Dogecoin’s current valuation. As such, any investment decision should balance historical insights with realistic expectations and sound risk management.


_webp.webp&w=1920&q=75)
_webp.webp&w=1920&q=75)