Bitcoin has spent four days trading consistently below the current short-term holder cost basis (STH-CB) of $75,717, which marks the approximate breakeven level for buyers within the last 155 days. Historically, this tends to elicit selling if there is any rally in the price that approaches cost basis, and therefore imposes an overhang into the market.
Following yesterday’s Consumer Price Index reading for October, BTC dropped further, falling to a low of $72,706, putting it 16.8 percent below the 21 September high of $87,392. This represents the deepest pullback of the uptrend that began at the 1 July low of $57,803.
The question now is whether the loss of the STH-CB is a correction inside a recovering market or the start of a deeper reset.
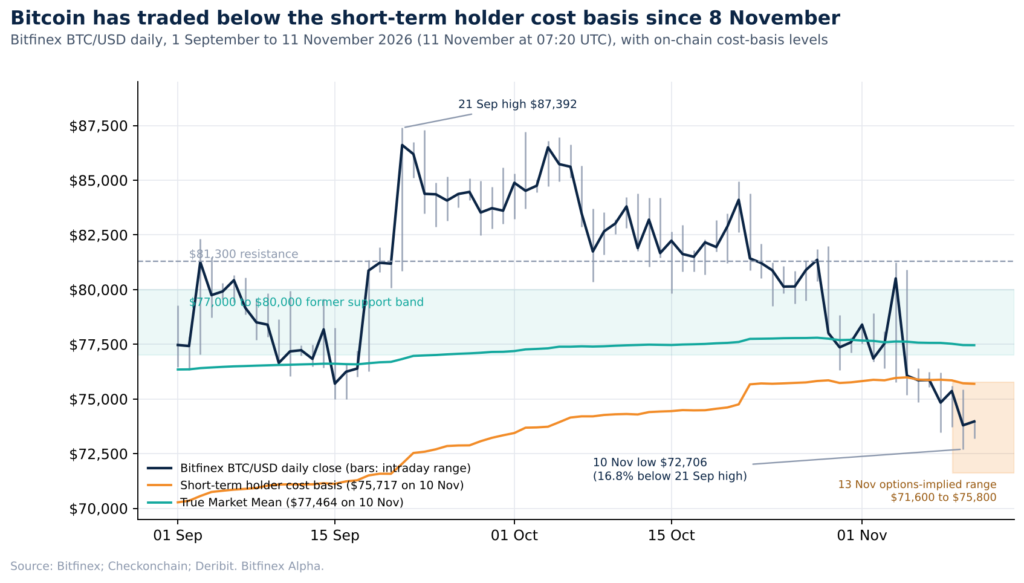 Figure 1: Bitfinex BTC/USD Daily Chart with the short-term holder cost basis, the True Market Mean and the 13 November options-implied range (Source: Bitfinex; Checkonchain; Deribit).
In our view, the answer is likely to come this month. Looking back on 14 earlier losses of cost bases since 2016 provides an indication of how long price can stay below the STH-CB before what looks like a correction becomes something deeper. We discuss this further below.
In this Intelligence Update, we also examine whether slowing Exchange Traded Fund (ETF) outflows can be enough to restore spot demand, what the options market is pricing and why altcoins are falling almost twice as fast as bitcoin. We also look at how rate expectations shifted after the CPI release, the growing asymmetry between bitcoin and the Nasdaq, and what Nvidia’s earnings on 17 November and the Anthropic listing on 19 November could mean for crypto.
BTC is currently rooted within the $72,350 to $79,400 options-implied range discussed in Monday’s Bitfinex Alpha, but market conditions have deteriorated. Aggregate futures open interest (OI) has risen to 701,900 BTC, with funding back near its neutral 10-11 percent annualised rate, while the share of supply in profit has slipped to 57.9 percent, below the 58.3 percent line that has historically separated corrections from deeper resets. The 10-year real yield has meanwhile risen to 2.78 percent, close to the 2.8 percent level at which we believe rates overtake equities as the dominant influence on bitcoin.
A disorderly move in price has so far been avoided, as ETF outflows have stayed well below $300 million this week and the Nasdaq 100 remains above its 5 November low.
Open Interest Remains Sticky While Spot Holders Sell at a Loss
Aggregate futures OI peaked at 701,900 BTC around the 11 November daily open. That is 3.3 percent above the 679,650 BTC recorded on 8 November, over a period in which price fell 2.6 percent, and marks the highest level of OI, since 22 September.
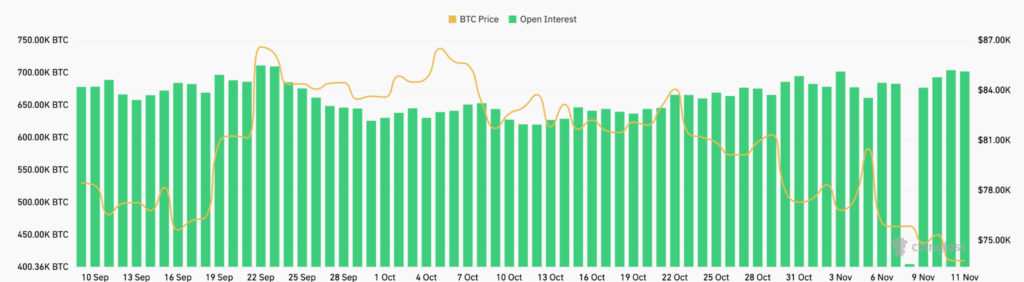 Figure 2: Aggregate bitcoin futures open interest in BTC terms against price (Source: Coinglass).
Indeed, the persistence of OI growth since early September is remarkable. When BTC fell following yesterday’s CPI, OI dropped just 0.2 percent, even after approximately $729 million in positions were liquidated, of which $581 million were longs, suggesting that positions are being replaced almost immediately. It was the sixth time since early October that traders have added positioning into a decline.
Perpetual funding has also sat at or near its average of about 11 percent annualised, which demonstrates that traders are willing to pay to stay long, even though the market has been dropping. Such behaviour also leaves the market exposed to further long liquidations.
BTC spot holders have taken the opposite view. The short-term holder Spent Output Profit Ratio (STH-SOPR), which compares the price at which coins younger than 155 days are sold with the price at which they were bought fell to 0.989 on 10 November. This was its lowest level since 13 July, showing that recent buyers are selling at an average loss of about one percent.
Across all holders, net realised losses have been recorded on 12 consecutive days to 10 November, totalling about 172,700 BTC. The pace of losses keeps the market in correction territory for now: about 14,400 BTC a day, against about 45,000 BTC a day during the May to July decline.
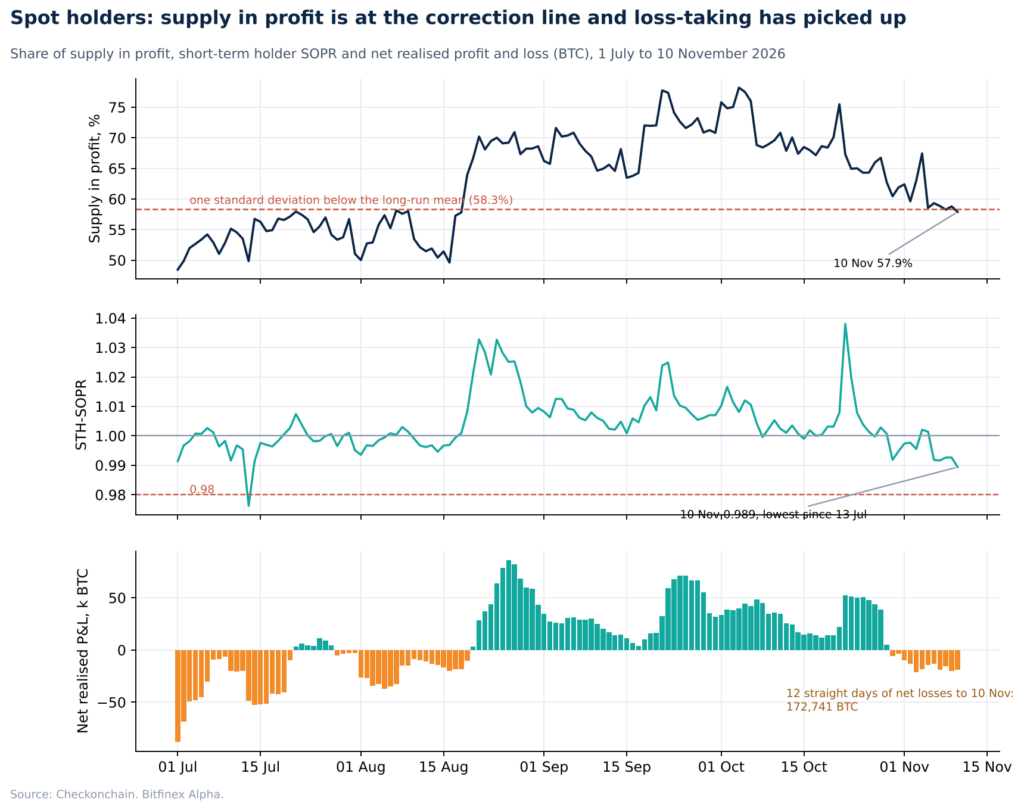 Figure 3: Share of supply in profit against its one-standard-deviation line, short-term holder SOPR and net realised profit and loss in BTC (Source: Checkonchain).
Cost-basis concentration between $70,000 and $75,000 rose by about 233,000 BTC between 8 and 11 November to 762,000 BTC. Despite that, 1.6 million BTC acquired between $75,000 and $80,000 is now held at a loss and any recovery must first work through that supply. A sustained recovery would require those holders to stop selling as price returns towards their cost basis.
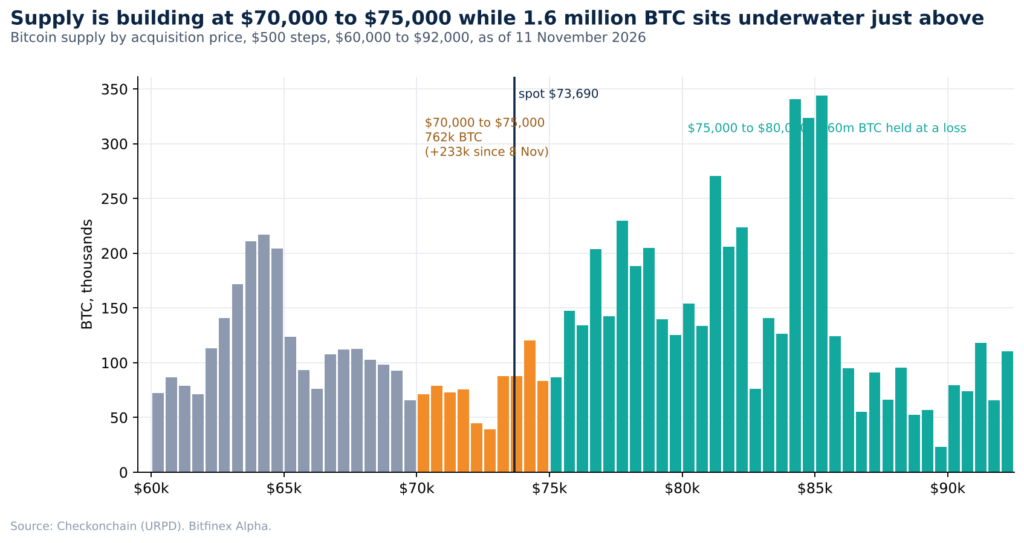 Figure 4: Bitcoin supply by acquisition price in $500 steps, $60,000 to $92,000, as of 11 November 2026 (Source: Checkonchain).
Cycle Position: Time Spent Below the Cost Basis Is the Test
Historically, the STH-CB has helped determine whether an uptrend marks the start of a new bull market or a recovery inside a longer bear market. Since 2016, bitcoin has fallen below the STH-CB 14 times after spending at least 60 days above it. In 11 of those instances, price reclaimed the level within two weeks. In the other three, the reclaim took between 57 and 114 days, and bitcoin’s low over the following 90 days was between 17 and 35 percent lower than the STH-CB.
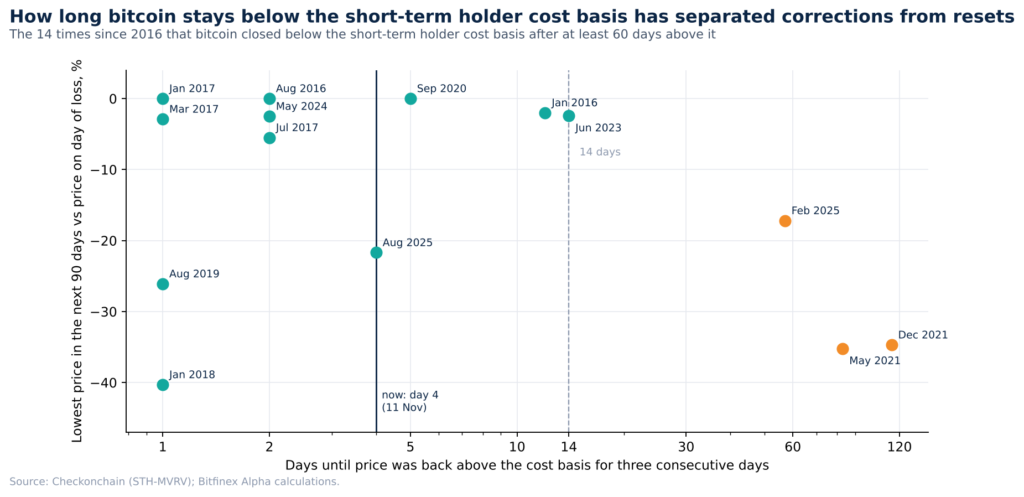 Figure 5: The 14 occasions since 2016 on which bitcoin lost the short-term holder cost basis (Source: Checkonchain; Bitfinex Alpha).
Bitcoin hovered within 0.2 percent of the STH-CB from 5 to 7 November and moved clearly below it on 8 November. The current episode is on its fourth day putting the two-week mark on 22 November, which will be both after Nvidia’s earnings and the Anthropic listing. Supply in profit adds to the caution: at 56.1 percent, it is below the 58.3 percent threshold.
ETF Flows: Outflows Are Slowing, and Treasury Demand Has Weakened
Bitcoin’s spot bid has two major demand engines: the US spot ETFs and bitcoin corporate treasury companies. ETFs have recently been selling their BTC holdings, although at a slower pace this week than last week. The funds recorded net outflows of $201 million on 9 November and $95 million on 10 November, extending the current outflow streak to four sessions, each smaller than the one before. Net outflows since 30 October sit at $2.22 billion, the largest eight-session outflow since 2 July.
Slowing outflows are a first step to finding a floor, rather than a signal on their own. Our 4 November Intelligence Update found that outflow runs earlier this year were followed by a median 10-session gain of 6.4 percent only when they ended with three or more consecutive inflow sessions. The test now is whether that pattern repeats.
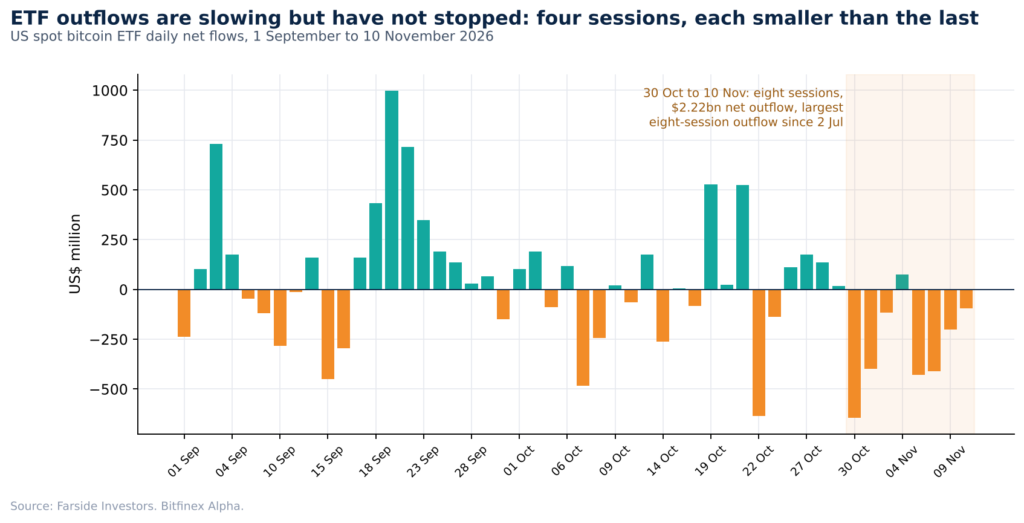 Figure 6: US spot bitcoin ETF daily net flows across all providers (Source: Farside Investors).
Treasury companies have moved from buyers to a potential source of supply. Strategy bought 1,036 BTC from 2 to 8 November, but its average cost of $75,456 leaves its 850,364 BTC holding underwater. MARA has also disclosed sales of 13,597 BTC over the past six weeks and plans to sell more. Furthermore, Trump Media, which held 4,260 BTC as of the end of September, faces potential cash repayments to convertible note holders on 30 November, which could be satisfied by BTC sales. Taken together, corporate treasuries are therefore not currently offsetting ETF selling.
Options: The CPI Premium Is Gone
The options market has become calmer rather than more defensive since the CPI report. At-the-money implied volatility (IV), the annualised move that option prices imply, fell to 37.8 percent for the 13 November expiry from 41.7 percent on 8 November. The premium of puts over calls also narrowed to 3.8 volatility points, from 8.2. This suggests that traders who had hedged the CPI release closed those hedges rather than rolling them. With realised volatility over the past 10 days at 47.9 percent, options are pricing a quieter market than recent price action would suggest.
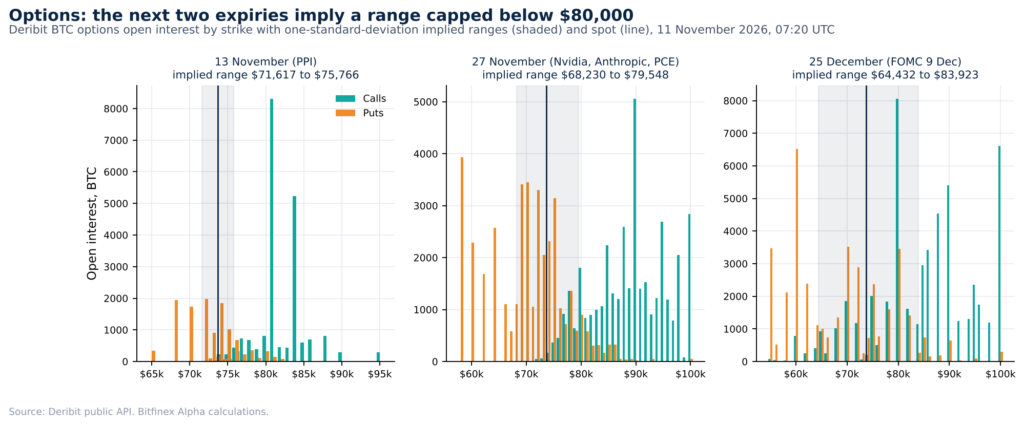 Figure 7: BTC options open interest by strike for the 13 November, 27 November and 25 December expiries with implied ranges, 11 November 2026 (Source: Deribit Metrics).
The implied one-standard deviation range is $71,600 to $75,800 for the 13 November expiry, which comes just before the October Producer Price Index report on the same day. The 20 November expiry carries lower implied volatility than this week’s, indicating that traders are not paying additional premium for Nvidia’s earnings or the Anthropic listing. Near-dated puts are concentrated at $72,000 and $70,000, levels where hedging flows could accelerate a decline.
Altcoin Losses Are Running at Almost Twice Bitcoin’s
The median of 12 large altcoins on Bitfinex is 27.8 percent below its 21 September close, against 14.8 percent for bitcoin. That is a ratio of 1.9 times, compared with the 1.1 to 1.9 times recorded across the six earlier pullbacks as we discussed in the 12 October Bitfinex Alpha. The ETH/BTC ratio fell to 0.0278 on 10 November, its lowest since 9 July. US spot ETH ETFs have recorded outflows on 11 of the 12 sessions since 26 October, totalling $983 million.
Two factors explain the gap: leverage is more concentrated in altcoins, as ether liquidations ($262 million) exceeded bitcoin liquidations ($205 million) in the 24 hours to the morning of 11 November, while speculative capital is also being drawn elsewhere, with Nvidia, semiconductor, SpaceX and Anthropic-linked contracts now appearing in the same derivatives venues and liquidation data as major crypto assets. If bitcoin tests $70,000, a further fall of about five percent, the ratios above imply a further eight to 10 percent decline for the median altcoin.
Macro: Rates Rejoin Equities as a Driver. The AI Trade Sets the Next Test
Core CPI rose 0.3 percent in October, above the 0.2 percent forecast, pushing rate expectations higher. The 2-year yield recorded its largest one-day rise since April 2025, while the 10-year yield traded above five percent before settling at 4.98 percent. Because short-end yields rose faster than long-end yields, the curve flattened, indicating that the market is pricing a more aggressive Federal Reserve rather than stronger growth. Gold fell with bonds as the real yield rose. Bitcoin fell 2.1 percent on the day against 0.6 percent for the Nasdaq 100, suggesting that rates, rather than technology shares, led for the first time since the equity sell-off began.
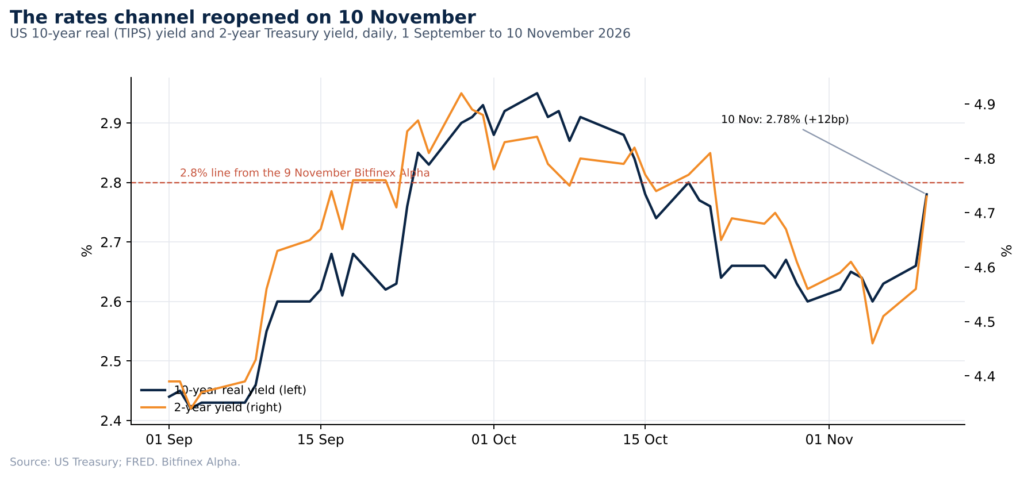 Figure 8: US 10-year real yield and 2-year Treasury yield, 1 September to 10 November 2026 (Source: US Treasury).
For what comes next, the more important shift is that bitcoin’s relationship with equities has become one-sided. Over the 25 sessions since the Nasdaq 100’s record on 6 October, bitcoin has taken 91 percent of the index’s losses on its down days and 58 percent of its gains on its up days. Over the 60 sessions before that, the equivalent figures were 23 percent and 129 percent. On 9 November, the Nasdaq 100 rose 3.4 percent and bitcoin was 0.7 percent lower than at the previous equity close.
In our view, this reflects the flows described above: without ETF or treasury buying, there is no marginal buyer to carry an equity rally into bitcoin, while leveraged long futures positions ensure that equity declines are transmitted in full.
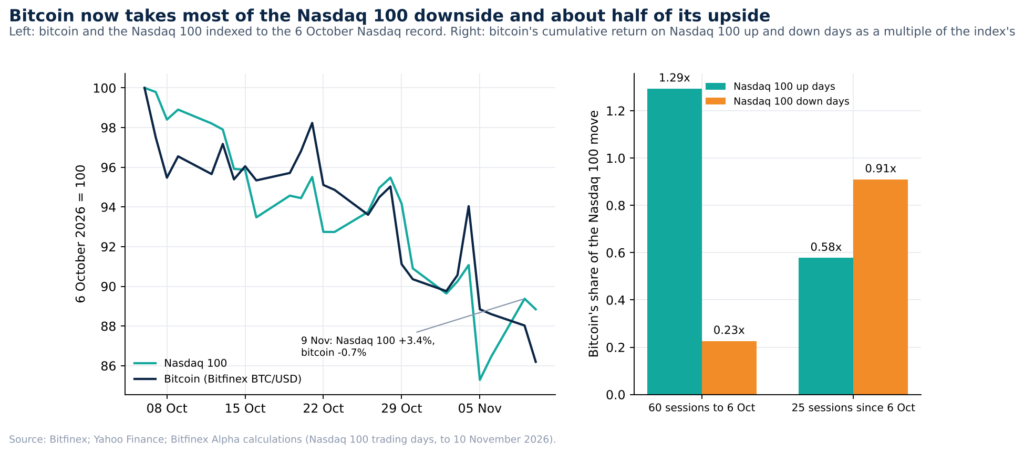 Figure 9: Bitcoin and the Nasdaq 100 since 6 October, and bitcoin’s share of the index’s move on up and down days (Source: Bitfinex; Yahoo Finance).
Next week tests that asymmetry. Nvidia reports earnings on 17 November with its shares 31 percent below their October high. Anthropic is also due to list on 19 November at a valuation of up to $64.4 billion.
We expect bitcoin to respond through three channels. The first is sentiment: Anthropic’s valuation is well below the roughly $2 trillion discussed in September, so its reception will be read as a verdict on AI valuations and transmitted to bitcoin through the Nasdaq. The second is liquidity, with about a fifth of the offering reserved for retail investors, drawing on capital that overlaps with crypto’s retail base. The third is direct: more than $260 million of open interest has built in pre-listing contracts on crypto derivatives venues, trading about 23 percent above the top of the range.
The SpaceX precedent suggests the listing day itself may not be the main price event: bitcoin was flat from the start of the roadshow on 4 June through the first week of trading, having already fallen 18 percent between the 20 May filing and the roadshow during a broader capitulation. Given the capture figures above, our reading is that a poor reception is a larger risk for bitcoin than a strong one is an opportunity, unless ETF flows have turned positive by then.
OUTLOOK
We expect bitcoin to trade within the $71,600 to $75,800 range implied by options for the 13 November expiry, with risks skewed towards the lower edge, because leverage has been rebuilt into the decline while ETF outflows have slowed but not yet reversed. Rallies towards the short-term holder cost basis at $75,717 are likely to be sold until spot demand returns.
A reclaim of that level alongside three consecutive ETF inflow sessions would indicate that the break below it was a correction. A 10-year real yield above 2.8 percent, or a Nasdaq 100 move below 26,606, would be expected to trigger long liquidations towards $70,000 to $71,200, while remaining below the cost basis by 22 November would place this episode among those that have historically led to deeper resets.
[ ](https://Javier Bastardo [12:24 PM] https://go.bitfinex.com/0feesbannermidweek)
The post appeared first on Bitfinex blog.