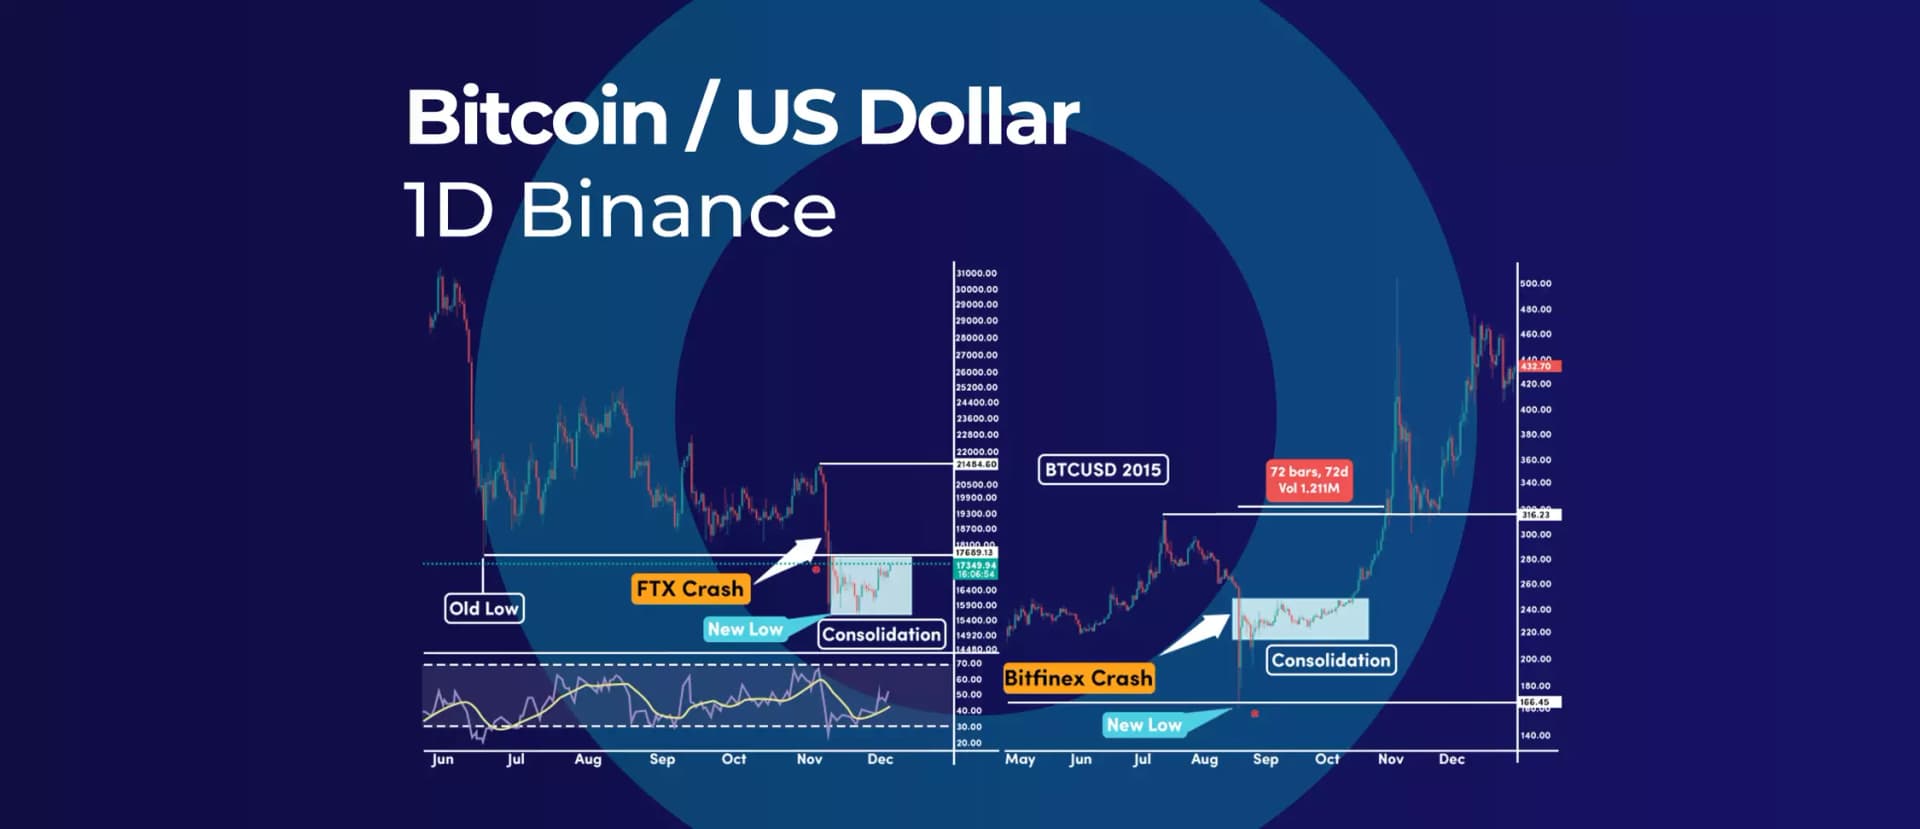
The fall of FTX and the subsequent Bitcoin's (BTC) price crash to new lows in 2022 resembles the same price action we saw in the aftermath of the Bitfinex-induced crash in 2015. This fractal comparison is a potential guide to what may happen next.
2015 Bitfinex Crash
For starters, the latest 2022 crash and the 2015 flash crash both have been triggered by macroeconomic events. Secondly, both crashes have led the Bitcoin price trading to new lows, breaking below the previous swing low.
The 2015 fractal pattern shows Bitcoin's price entering into a multi-week consolidation pattern right after breaking into new lows. As a result, anticipations that Bitcoin's price will undergo a similar consolidation pattern are increasing.
Notably, the 2015 price action saw Bitcoin price breaking above the previous swing high after 72 days. If the 2015 fractal repeats itself in 2022, Bitcoin's price can break above the previous swing high of $21,500 by the end of January 2023.
The 2015 fractal map remains valid as long as the current swing low of $15,473 holds the downside. A break below November's low will likely expose the 2019 high of 13,870.


_webp.webp&w=1920&q=75)
_webp.webp&w=1920&q=75)