.webp&w=3840&q=75)
Let's see how we can beat the market trading Render Token (RNDR) with the Parabolic SAR!
Let's see how we can beat the market trading Render Token (RNDR) with the Parabolic SAR!
Trading with the Parabolic SAR
The Parabolic SAR is a trend-following indicator created by J. Welles Wilder, which uses a series of dots above or below the price to indicate bullish or bearish trend direction.
It provides continuous buy or sell signals as long as the conditions persist.
This makes the Parabolic SAR a great indicator to use together with other indicators.
For example, the Parabolic SAR can be used to find the overall trend on the larger timeframe, and an oscillator on a smaller timeframe can find the pullbacks of the overall trend.
However, this analysis focuses purely on the Parabolic SAR, so we won’t get into how you can combine it now.
Which indicators work well with the Parabolic SAR?
When trading, it's advisable to confirm a signal by relying on several technical indicators rather than just one.
To enhance SAR trading signals, try using other indicators such as the Average Directional Movement (ADX), moving average, or Stochastic.
For instance, SAR sell signals become more convincing when the price trades below a long-term moving average. This suggests that sellers control the direction and that the SAR sell signal could be the start of another wave down.
In contrast, focus on taking the buy signals when the price is above the moving average (dots move from above to below). Although the SAR indicator can still act as a stop-loss, it's unwise to take short positions since the longer-term trend is upward.
Some traders argue that using the parabolic SAR can result in numerous trades. The chart provided displays multiple trades, and using the moving average alone could have captured the entire up move in one trade. Therefore, active traders who aim to catch a high-momentum move and exit the trade frequently use the parabolic SAR.
The parabolic SAR works best in markets with steady trends; in ranging markets, it tends to generate false trading signals, resulting in whipsawing back and forth.
Best Parabolic SAR strategy for RNDR
At Cryptohopper, we strive to bring you the best settings for each technical indicator, including the Parabolic SAR, to help you make informed trading decisions.
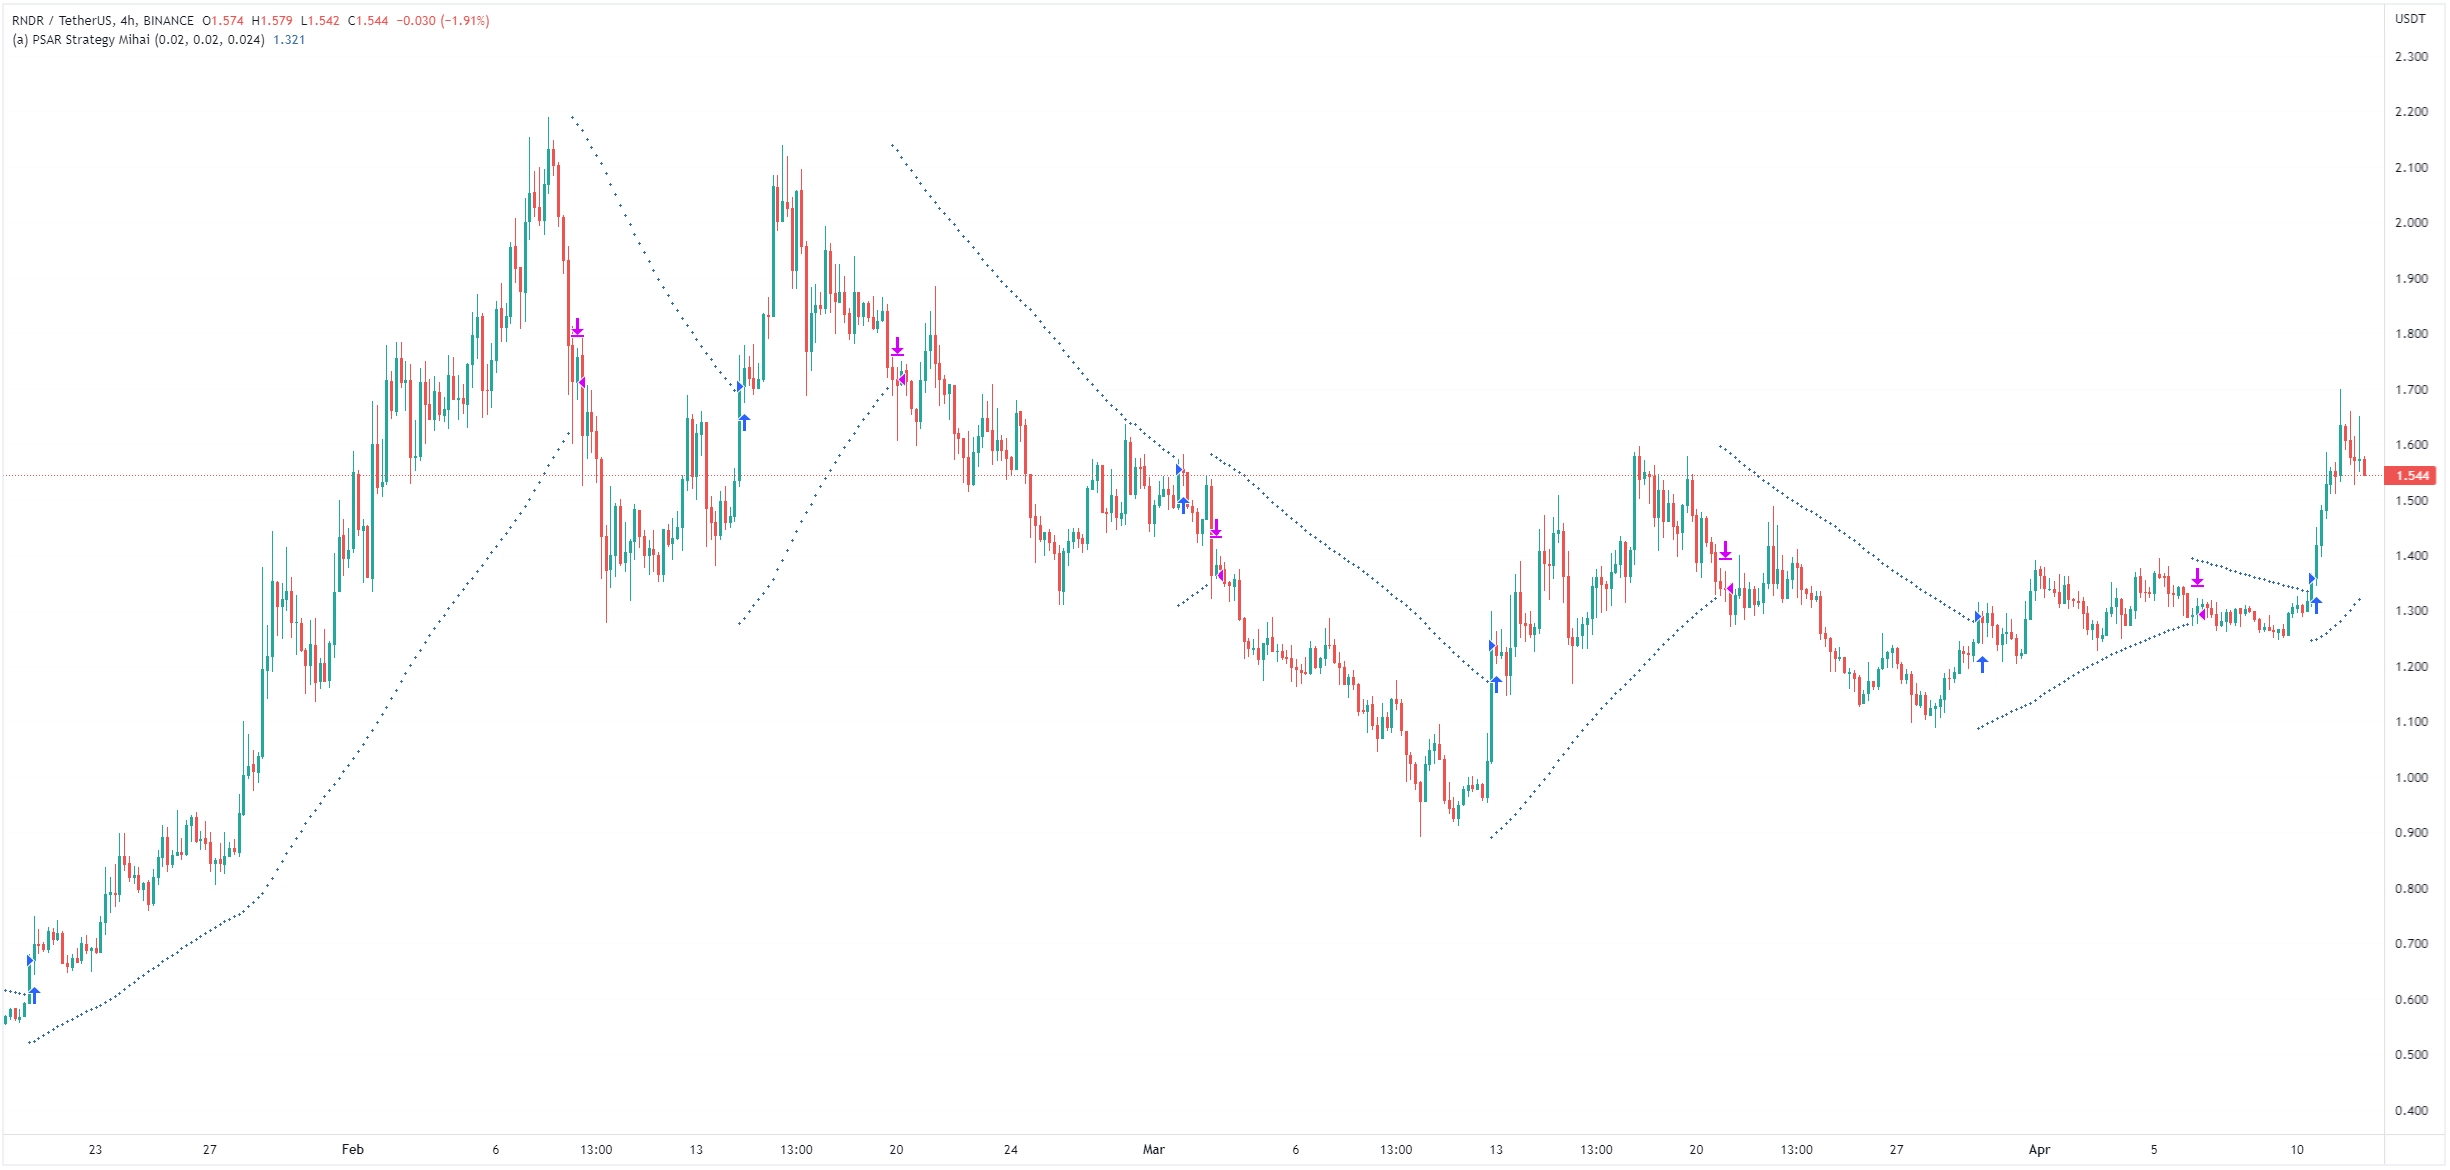
In our backtest from 2021-11-27 to 2023-03-25, we found that the following settings for the Parabolic SAR worked best for trading RNDR:
Chart period: 4 hours
Acceleration Factor: 0.02
Acceleration Maximum: 0.024
These settings brought returns of 130%, a lot more than the buy-and-hold strategy's of -78% returns. Additionally, the maximum drawdown for this strategy is a lot smaller at 57% compared to the buy-and-hold strategy's 96% drawdown.
Disclaimer: Past performance does not guarantee future success, as the way the market fluctuates can change at any time.


_webp.webp&w=3840&q=75)
_webp.webp&w=3840&q=75)


