.webp&w=1920&q=75)
Explore six top crypto trading indicators on Cryptohopper, including EMA, Williams %R, RSI, and more for successful cryptocurrency investment strategies.
With so many indicators available for cryptocurrency analysis, it can be challenging to decide which ones to use. Today, let's discuss this together.
We'll review the top six most commonly used technical indicators for crypto trading and explore how to implement them on Cryptohopper. These top six indicators are:
- Williams %R
- RSI + RSI with region crossovers
- MESA adaptive moving average
- Parabolic SAR
- Bollinger Bands
Let's dive into the Exponential Moving Average, or EMA for short. Among the various moving averages like SMA, TEMA, DEMA, and HULL, the EMA holds a prominent position in the crypto market.
The key reason it's so widely favored is its knack for providing a smooth and distinct line on the chart. How does it do this? By averaging candlesticks over a specific timeframe , it helps remove the clutter and noise from the market.
This clarity is incredibly valuable for you as a trader, as it empowers you to make informed decisions about the current trend direction.
Remember, you have the flexibility to choose the number of periods for the EMA based on your preferences. Generally, shorter periods like 9, 10, 15, and 20 days result in quicker EMA responses, while longer periods like 50, 100, 200, and 300 days create a slower response.
Using the EMA on Cryptohopper.
Trading with moving average strategies on Cryptohopper offers numerous options.
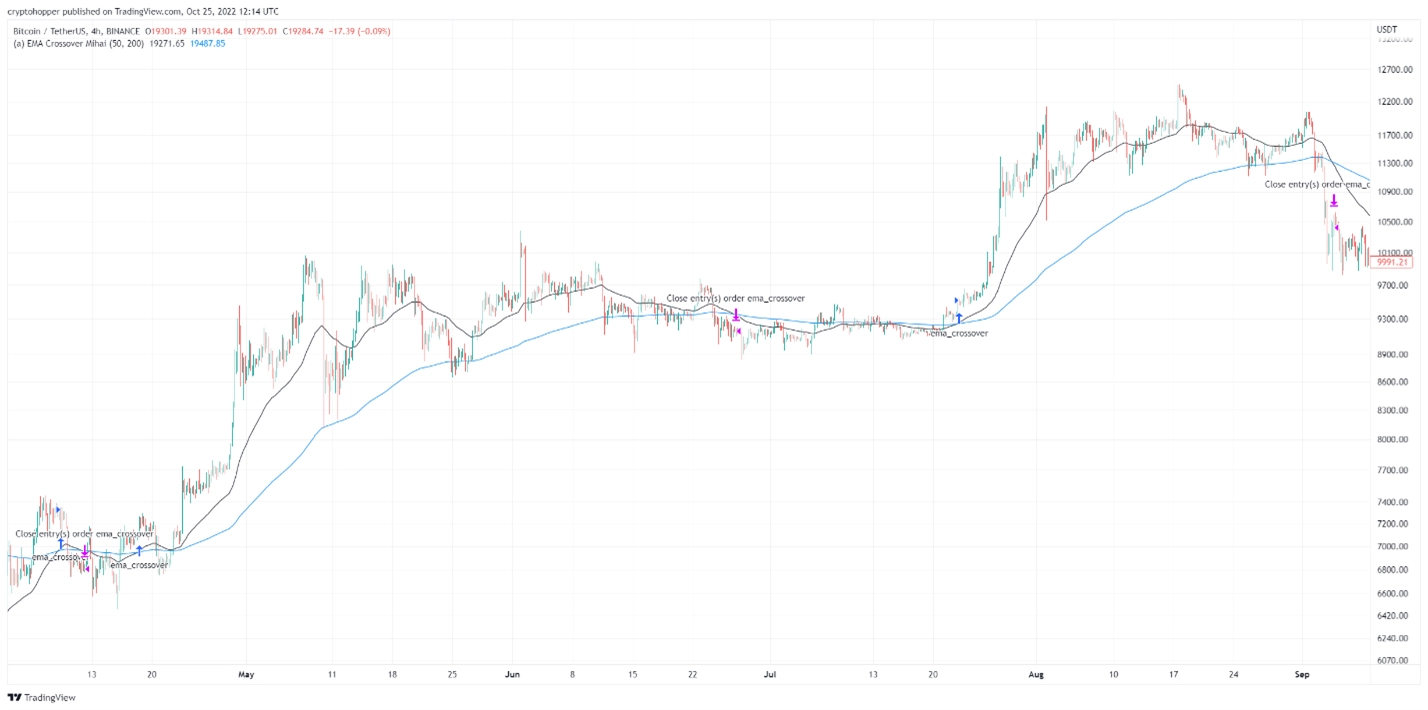
In our approach, we employ two moving averages: one with a shorter period and another with a longer period. Here's the simple rule: when the shorter moving average crosses above the longer one, it triggers a buy signal.
Conversely, if the longer moving average crosses above the shorter one, it generates a sell signal.
Here's a simple example: if the 50 EMA crosses above the 200 EMA, it's a buy signal. Conversely, if the 50 EMA crosses below the 200 EMA, it's a sell signal.
In the case of a buy signal, it means the cryptocurrency is likely on an upswing because the average of the last 50 periods is greater than the average of the last 200 periods.
In practice, moving averages, including the EMA, are most effective on higher timeframes, specifically those of 4 hours and above. This is because they are designed as trend-following indicators, and trends are most apparent on longer timeframes.
The EMA shines when there's a clear trend, like the one observed on Bitcoin from March 2020 to November 2021. It's well-suited for identifying the start of a trend and riding it until its conclusion.
It's important to note that the EMA and other moving averages can struggle in ranging markets. Ranging markets occur when a cryptocurrency is moving within a set price range, like Bitcoin did between $17,000 and $25,000 in September 2022.
Moving averages perform poorly in such situations because, for instance, when Bitcoin begins to approach $25,000, the moving averages might signal a buy. Why? Because the EMA assumes this upward movement marks the beginning of a new trend.
However, in reality, it's still a ranging market, and using moving averages during these times can lead to less reliable signals. This is an essential consideration for traders in various market conditions.
When it comes down again, the EMA will trigger a sell signal at a lower price, say around $20,000, as it believes a new downtrend is starting. This means that in a ranging market, you might end up buying at a higher price and selling at a lower one, which is far from ideal in trading.
As we've mentioned before, the EMA is just one indicator, and it's essential to understand that indicators often aren't sufficient on their own.
To maximize their effectiveness, it's a good practice to use EMAs in conjunction with other indicators, risk management strategies, or price action analysis. You can compliment the EMA for example with oscillators to provide a more comprehensive view of the market.

Overall, trend-following indicators like the EMA don’t work well with take profit or trailing stop loss. Why? Because if you rely on trend-following indicators for both your entry and exit points, your profit per trade can vary significantly.
Moreover, implementing a take profit or trailing stop loss might restrict your profit potential. However, a stop loss can be quite useful, especially when you're working with longer moving averages like the 50 and 200.
Longer moving averages are slower to react, and they might not respond in time during a flash crash, which is a sudden sharp drop in a coin's value—a relatively common event in the crypto market. In such cases, a stop loss can help prevent substantial losses.
It's crucial to consider these factors when planning your trading strategy.
In summary, the EMA is a useful trend-following indicator, but it's most effective when used alongside other indicators, such as an oscillator. Now, speaking of oscillators, let's move on to the next indicator, the Williams%R oscillator.
Williams %R
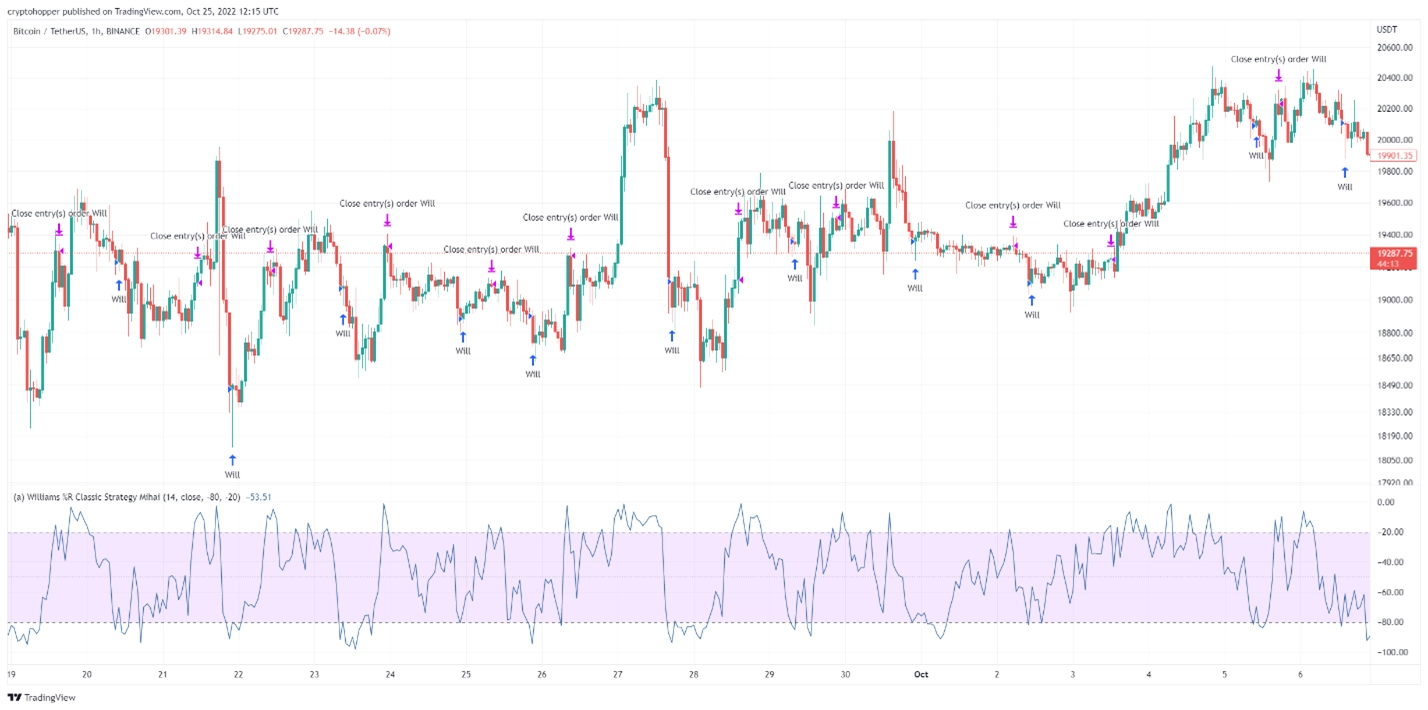
Oscillators, in simple terms, are indicators that swing back and forth between two values. The Williams %R oscillator, for instance, oscillates between -100 at the bottom and 0 at the top. By default, it considers the last 14 periods for its calculations.
But how does the Williams %R oscillator function? Here's the deal: when Williams %R has a value below -80, it's considered oversold, indicating a recent price drop.
Conversely, when the value is above -20, it means the asset is overbought, signifying a substantial price increase.
The common approach is to buy when Williams %R signals oversold conditions, meaning you're buying at a lower price, and to sell when it indicates overbought conditions, suggesting you're selling at a higher price.
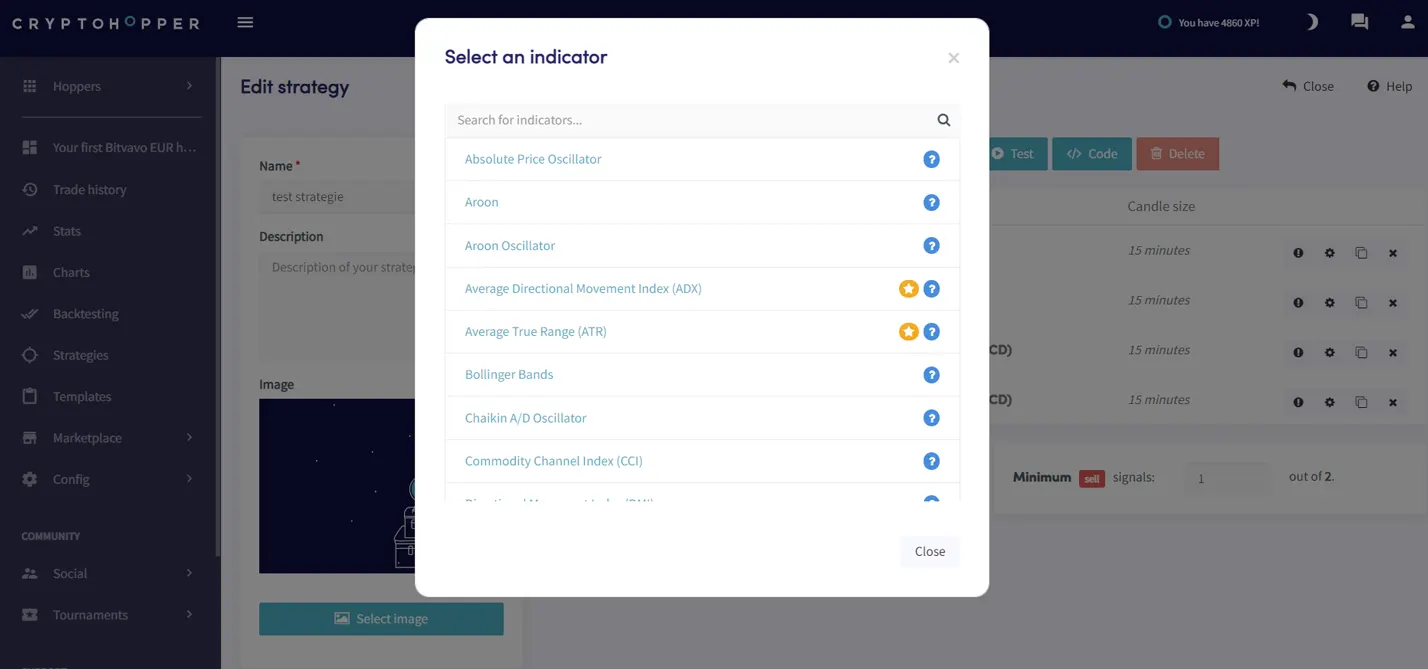
Using the Williams%R on Cryptohopper
By default, the indicator uses values of -80 for oversold, -20 for overbought, and 14 for the number of periods. However, it's important to know that on most trading platforms, including Cryptohopper, you have the flexibility to adjust these values to better suit your trading strategy and preferences.
A fantastic feature of Williams %R and other oscillators in Cryptohopper is their flexibility and customization. You can set your own buy and sell signals to be above or below a specific value on Cryptohopper, giving you ample room to tailor your strategies to your liking.
For instance, you can create a strategy that buys when the Williams %R signals oversold conditions and sells when it indicates overbought conditions (values less than -80 or greater than -20, respectively).
Here's an interesting twist: on Cryptohopper you have the option to tweak the settings to buy when the Williams %R indicates overbought conditions and sell when it signals oversold conditions.
This essentially transforms the oscillator into something resembling a trend-following indicator, like the EMA. This flexibility allows you to experiment with various approaches and find the one that aligns best with your trading style and market conditions.
Adding to the customization options, oscillators on Cryptohopper offer the advantage of "sticking signals" when you use the greater than or less than settings. Sticking signals are essentially ongoing signals that persist as long as a specific condition is met.
For instance, you can configure Williams %R to keep sending buy signals as long as its value remains below -80 and consistently send sell signals as long as the value stays above -20.
Now, just like the EMA, Williams %R is also great when used together with other indicators. For example, a user could set Williams %R to buy when it is less than -50, and when the EMA provides a buy signal.
This combination would thus make Williams %R act like a filter to ensure you are buying relatively low.
Here's another handy feature on Cryptohopper called the "Keep candle for" option. As the name implies, when you have this option enabled, a signal will persist for a specified number of candles after it's generated.
This can be particularly useful when you're using it in conjunction with other indicators, providing you with more flexibility in your trading strategies.
Here's a practical example: Let's say you're using both the EMA and the Williams %R together. You can create a trading system where a buy signal triggers when Williams %R drops below -90, indicating the coin is significantly oversold.
Normally, the EMA alone wouldn't generate many trades because EMA crossovers rarely occur at such extreme oversold levels. However, by employing the "keep candle for" feature, you can craft a potentially successful strategy.
In essence, you'll be buying after the market experiences a sharp decline signaled by Williams %R and then when it starts recovering thanks to the EMA.
Unlike the EMA, oscillators are most effective on smaller timeframes like 1 hour or 30 minutes. The reason is that these shorter timeframes are better suited for spotting short-term price reversals or pullbacks.
In contrast, larger timeframes excel at revealing the broader, long-term trends in the market. So, if you're using oscillators, consider focusing on these shorter timeframes to pinpoint temporary shifts in price.
In contrast to the EMA, Williams %R pairs effectively with take profit and trailing stop loss orders. This is because traders often buy after minor corrections, making a smaller take profit more suitable in these cases.
Williams %R is known as a sensitive oscillator, particularly when compared to something like the RSI. As a sensitive indicator, it responds quickly to smaller price movements, reaching oversold levels faster.
Consequently, you'll likely see more trades using Williams %R than with the EMA or other oscillators. However, it's essential to note that the profit per trade may be smaller due to the higher frequency of trades.
It's worth mentioning that a stop loss can be a valuable addition when using Williams %R and other oscillators. One of the key challenges with oscillators is that they can stay in oversold conditions for extended periods.
Remember, just because a coin is low and oversold doesn't guarantee it won't go even lower. In such cases, a well-placed stop loss serves as a safeguard, helping to mitigate potential losses by limiting the downside risk.
To sum it up, it's crucial to understand that oscillators excel in ranging markets where the price lacks a clear direction. In this scenario, oscillators help you buy low when the price is near the bottom of the range and sell high as it approaches the top of the range.
This contrasts with the EMA, which operates differently. Recognizing when to use oscillators versus trend-following indicators like the EMA is key to making informed trading decisions in varying market conditions.
Oscillators, on the other hand, aren't well-suited for trending markets because prices in a trend can keep moving in the same direction. Even if you buy low, the price might continue to drop further, leading to multiple losses in a downtrend.
Similarly, this concept applies to Williams %R in an uptrending market. Just because something is overbought doesn't mean the price can't keep rising. Consequently, traders may miss out on significant profit potential by not riding the trend.
To sum it up, Williams %R is an excellent oscillator for use in a ranging market. Now, as we touched on the RSI earlier, let's delve into it!
RSI + RSI with region crossovers
The RSI, or Relative Strength Index, is an oscillator that shares similarities with Williams %R and operates in a similar manner.
The main differences are that:
- The RSI is significantly less sensitive, so it takes a bigger move in the market to bring it to either oversold or overbought.
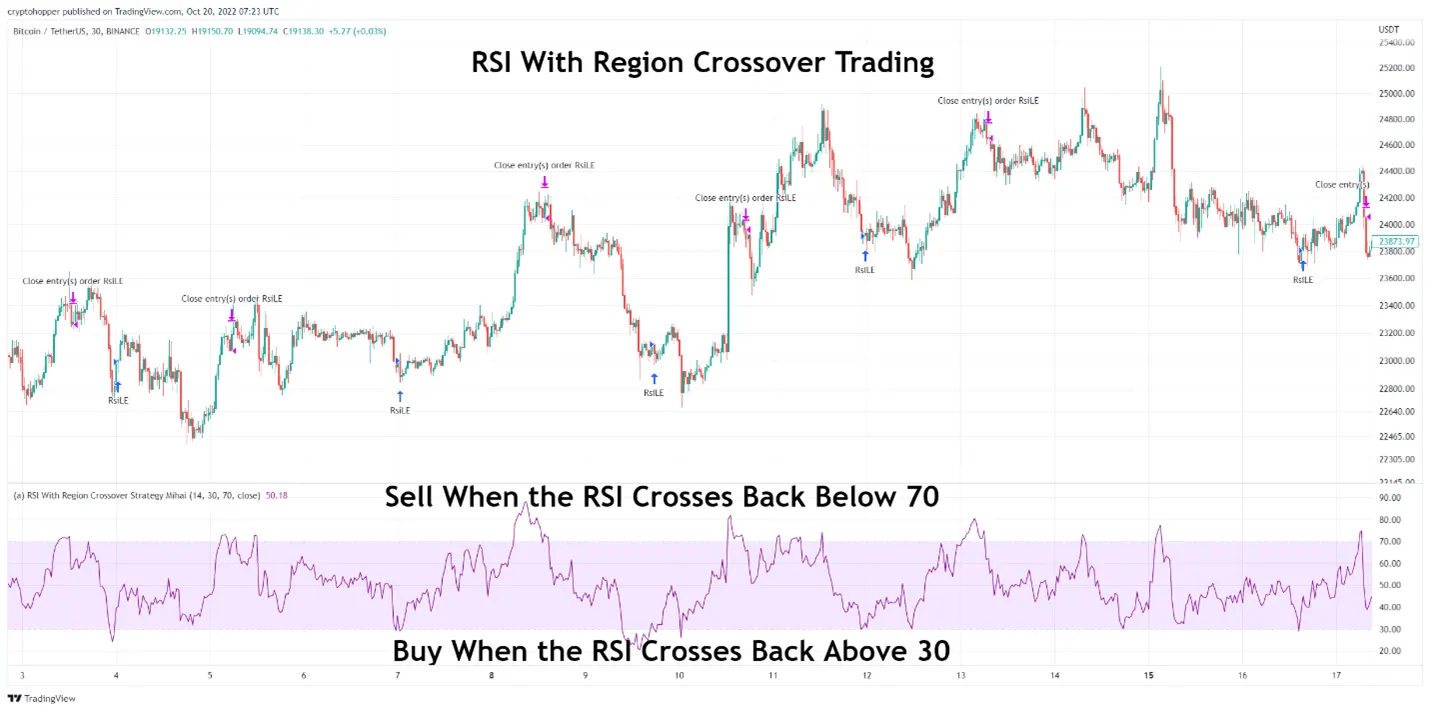
- The oversold and overbought levels are different. The RSI oscillates between 0 and 100, with 30 considered oversold and 70 considered overbought.
The RSI on Cryptohopper functions similarly to Williams %R, but there's another variation of the indicator called RSI with Region Crossovers that you should be aware of.
The RSI with Region Crossovers functions with the same RSI values, but its trading approach differs. With this variation, a buy signal triggers when the RSI emerges from an oversold region.
For instance, if you set the RSI oversold level at 30, a buy signal is generated when the RSI dips below 30 and then rises back above it. This feature addresses a common challenge with oscillators regarding trends.
By incorporating region crossovers, you're not buying a coin in a continuous downtrend; instead, you're buying a coin that is showing signs of recovery.
Conversely, the sell signal for the RSI with Region Crossovers works in the opposite manner. It triggers when the RSI surpasses the overbought threshold and then drops back below it.
For example, if the overbought threshold is set at 70, a sell signal occurs when the RSI crosses above 70 and then falls back below it. This concept is particularly beneficial in trending markets because just as assets can stay oversold for extended periods, they can also remain overbought for an extended time.
Consequently, with the RSI with Region Crossovers, traders are better aligned with the trend and can potentially sell at significantly higher prices compared to a regular oscillator in a strong trend.
However, it's important to note that the RSI with Region Crossovers provides a one-off signal rather than a continuous one, as seen in some other oscillators. Therefore, you'll only receive one signal at the crossover point.
To make the most of it, you may consider using the "keep candle for" feature in conjunction with other indicators that generate single signals. Alternatively, you can pair it with trend-following indicators like MESA or Parabolic SAR, which do provide continuous signals.
So, that concludes our discussion of the RSI with Region Crossover. And since we just mentioned the MESA, let's dive into it now!
MESA
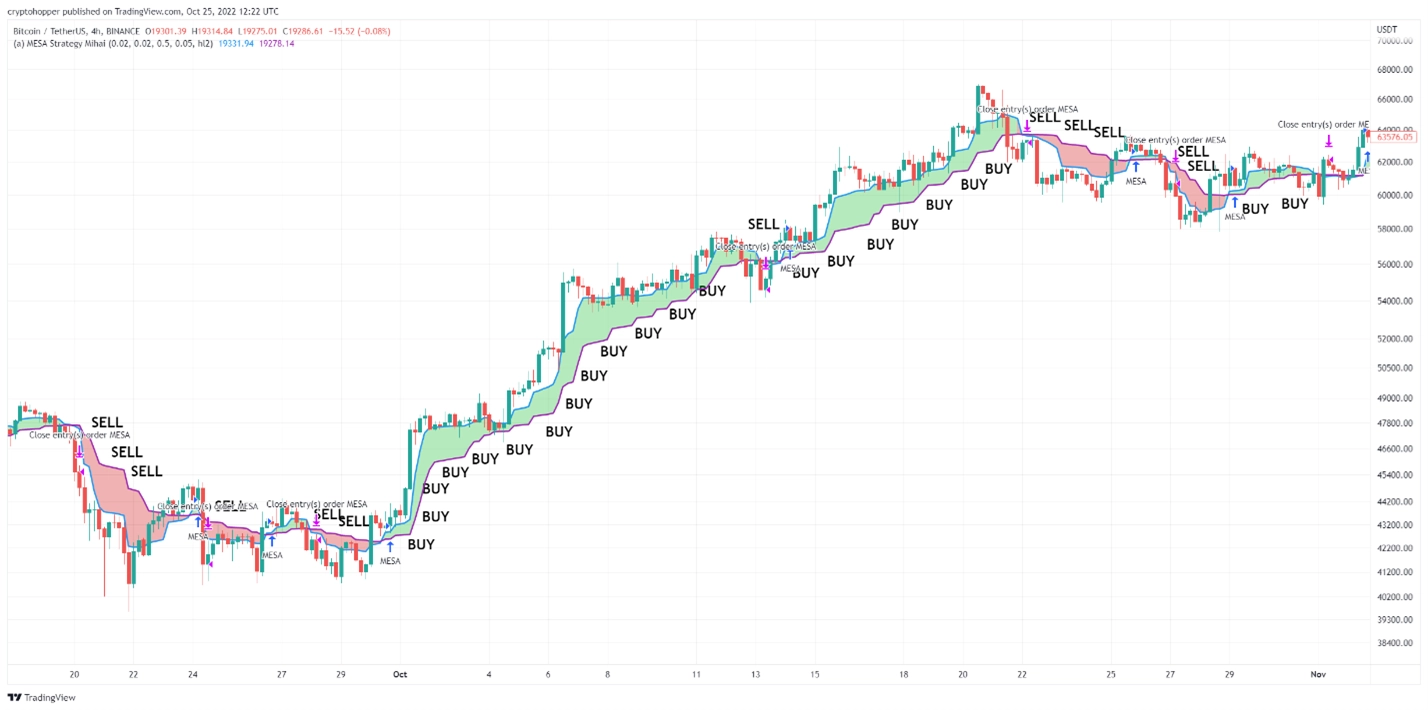
The MESA Adaptive Moving Average is another trend-following indicator, much like the EMA. However, there's a key distinction between the MESA and the EMA on Cryptohopper: the MESA generates sticking signals, while the EMA does not.
When the moving average, often referred to as the MAMA, remains above the MESA's long moving average, known as the FAMA, it triggers a buy signal.
Some trading platforms even display a green cloud when the MAMA is above the FAMA, which provides a helpful visual cue. Conversely, when the situation reverses, a red cloud appears on the chart.
The MESA and EMA employ different mathematical formulas, leading to varying reactivity. The MESA is an adaptive moving average, meaning its sensitivity to price changes adjusts based on market conditions.
In terms of inputs, the MESA differs significantly from the EMA. Its default values are 0.5 for the Fast limit and 0.05 for the Slow limit. Larger values result in more trades, so, for example, setting a Fast limit of 0.7 and a Slow limit of 0.075 will generate more trades than the default settings.
When it comes to sell settings, the MESA typically pairs well with a stop loss. Using a take profit or trailing stop loss may hinder its ability to secure significant gains. The MESA is most effective on larger timeframes, such as the 4-hour chart or higher.
However, one of its standout features is its compatibility with other indicators. The MESA, as a trend-following indicator with sticking signals, serves excellently as a filter.
A filter, in this context, is a technical indicator that helps sift out false signals. One of the best applications for the MESA is to place it on longer timeframes to determine the trend's direction.
Once the MESA identifies the overall trend, you can utilize an oscillator like the RSI or Williams %R on a shorter timeframe to pinpoint entry and exit points. Other indicators that can complement the MESA filter on a shorter timeframe include the MACD and Bollinger Bands, as well as additional moving averages.
So that's a glimpse of the MESA, one of our favorite indicators. However, there are other fantastic options to explore, such as the Parabolic SAR.
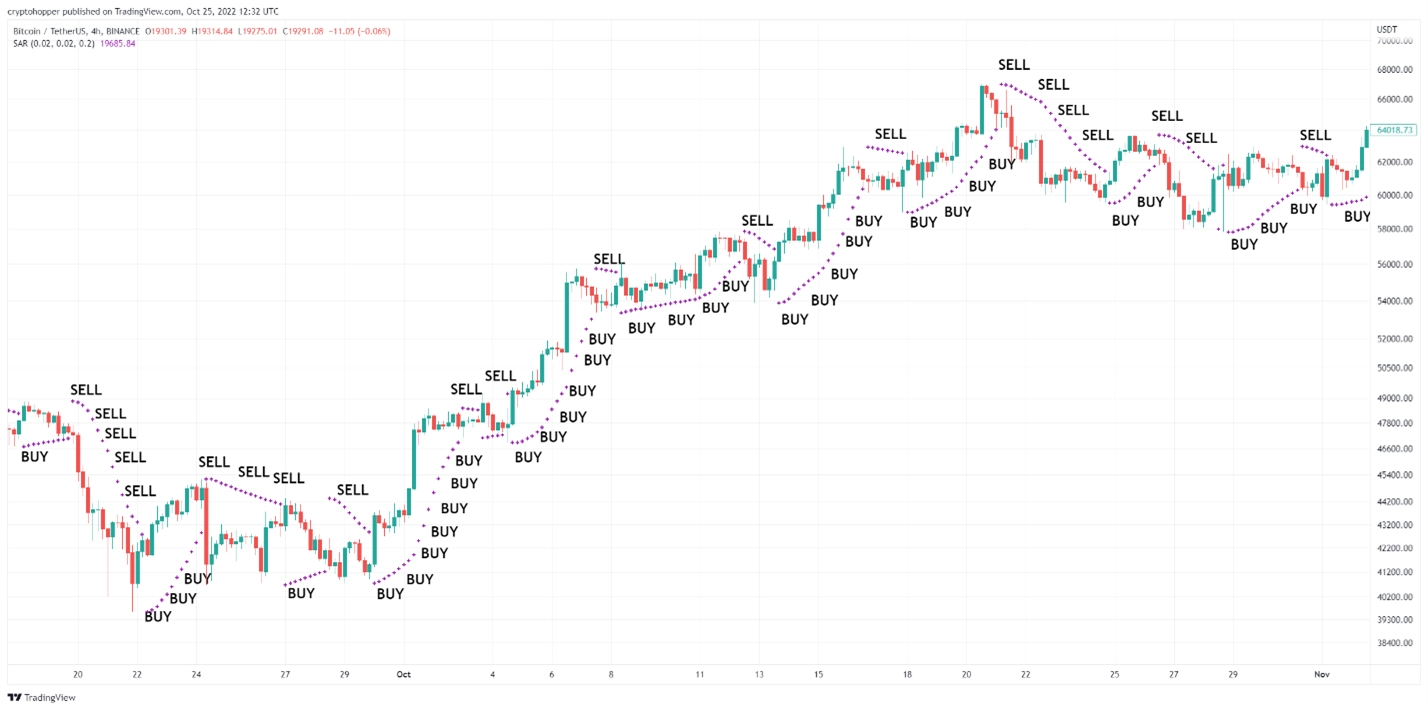
Parabolic SAR
The Parabolic SAR, or PSAR for short, is another indicator in the same vein as the MESA. Essentially, the Parabolic SAR is yet another trend-following indicator that provides sticking signals.
However, its appearance on the chart is quite distinct from the MESA. The PSAR typically consists of small crosses or dots, which can vary depending on the trading platform. These marks appear either below or above the candlesticks.
So, when you're analyzing a chart, if you see the crosses positioned below the candles, it signifies a bullish Parabolic SAR, and it will continue sending buy signals.
Conversely, when the crosses are located above the candles, it indicates a bearish indicator, and it will persistently generate sell signals.
Using the Parabolic SAR on Cryptohopper
On Cryptohopper, the Parabolic SAR shares quite similar input settings with the MESA. The default values include 0.02 for the Acceleration Factor and 0.2 for the Maximum.
Just like with the MESA, higher values for these parameters result in more frequent switches between buy and sell signals.
A key distinction between the Parabolic SAR and the MESA is the Parabolic SAR's heightened sensitivity to trend changes, making it react more quickly.
This characteristic makes the PSAR a more suitable filter for cryptocurrencies that tend to change directions rapidly.
Another factor that sets these two indicators apart is how they treat the highs and lows of candlesticks. For the Parabolic SAR, the highs and lows of candles are of paramount importance.
If the high or low of a candle touches the cross of a Parabolic SAR, the indicator will change direction accordingly. For instance, if the Parabolic SAR is bullish with crosses positioned below the candles, and a candle exhibits a substantial downward wick touching its low, the Parabolic SAR will become bearish, and the crosses will shift above the candles.
In contrast, the MESA, by default, primarily considers closing prices and disregards highs and lows.
However, it's important to note that the Parabolic SAR may not perform well with cryptocurrencies that experience significant swings in both their highs and lows.
For such coins, where the overall trend remains consistent despite these fluctuations, the Parabolic SAR can change direction too frequently. In these cases, the MESA may be more suitable.
With that, we've covered the Parabolic SAR. Now, let's delve into the final indicator for today, the Bollinger Bands, often abbreviated as "BB."
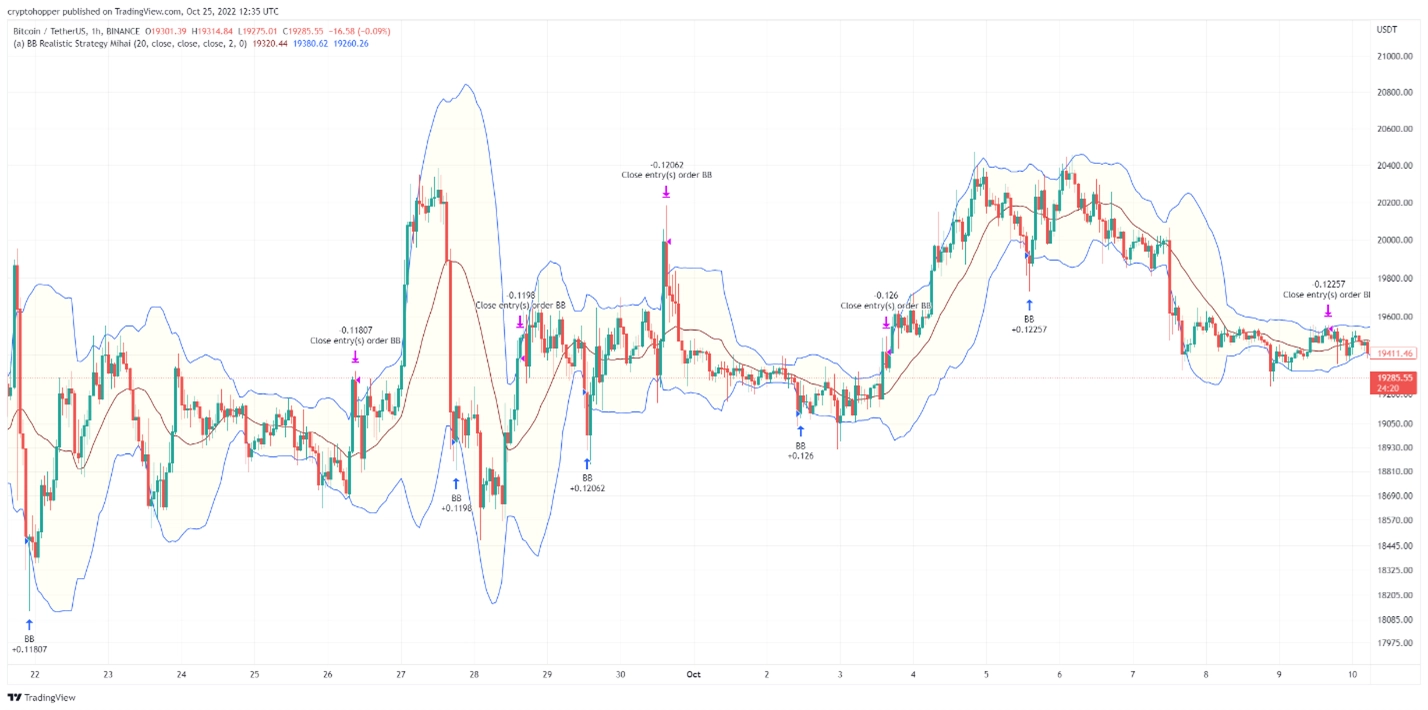
BB Bollinger Bands
Bollinger Bands stand out as a distinct type of indicator, different from both traditional indicators and oscillators, and many consider it a volatility indicator.
Here's how Bollinger Bands are structured: In the center, you have a simple moving average (SMA), and it is flanked by an upper limit line above and a lower limit line below.
The upper limit line is positioned at two standard deviations above the SMA, while the lower limit line sits at two standard deviations below the SMA.
The behavior of Bollinger Bands varies with market conditions. In stable or less volatile markets, the upper and lower limit lines tend to contract, bringing them closer to the middle SMA line. However, in times of heightened market volatility, these limit lines expand, moving farther away from the middle line.
Using the Bollinger Bands on Cryptohopper
Bollinger Bands, when used on Cryptohopper, offer a unique approach to trading. Here's how they work:
* A buy signal is generated when the price falls below the lower limit.
- A sell signal is triggered when the price rises above the upper limit.
This characteristic sets Bollinger Bands apart. In a ranging market where price fluctuations are limited, Bollinger Bands may yield smaller profits as the bands are close together.
Conversely, in a trending market with more significant price movements, the bands widen, potentially leading to larger profits.
For optimal use, consider applying Bollinger Bands to hourly charts, although performance can vary across different cryptocurrencies. It's advisable to backtest and practice with paper trading before using this indicator with real funds.
Keep in mind that Bollinger Bands should be paired with a stop loss to limit potential losses, especially in bear markets.
While take profit and trailing stop loss strategies can also be employed, exercise caution, and analyze individual coins as their volatility levels may vary. You can customize settings on Cryptohopper using the Config Pools feature to suit different coins.
Conclusion
We've discussed several indicators today, including EMA, Williams %R, RSI, RSI with Region Crossovers, MESA, Parabolic SAR, Bollinger Bands, and more.
The key takeaway is that while these indicators provide valuable insights, what truly matters is how you combine them to create a winning strategy.
We hope you've found this blog informative and enjoyable. If you have any other indicators you'd like us to cover or if you have additional questions, please feel free to reach out. Happy trading!


_webp.webp&w=1920&q=75)
_webp.webp&w=1920&q=75)