
Learn about how you can create, link and use your hopper account with Poloniex
Create an account at Poloniex
First, we're going to create your Poloniex account. Go to Poloniex.com
After registration, you will have to verify your account. This is to prevent money laundering.

Funding
On Poloniex, your Hopper will trade in terms of Bitcoin. The main goal on Poloniex is to collect more Bitcoins.
Navigate to "Balances" and go to "Deposits & Withdrawals".

Funding
Search for Bitcoin and click Deposit. You will see your Bitcoin Deposit address. Send your Bitcoins to this address.
Double check that you've selected Bitcoin and the address you are sending your Bitcoins to.
Don't have any Bitcoins? get them at coinbase!

Funding
To trade on your behalf, we need permission from you. Therefore, we need an API key.
Go to the "Setting" drop-down menu and click API Keys.

Click "Generate New Key"

API Key
We will need your API key and your secret key.
*IMPORTANT
We do not want withdrawal permissions! We merely need to read the information and make limit orders. This also boosts your security as a customer!

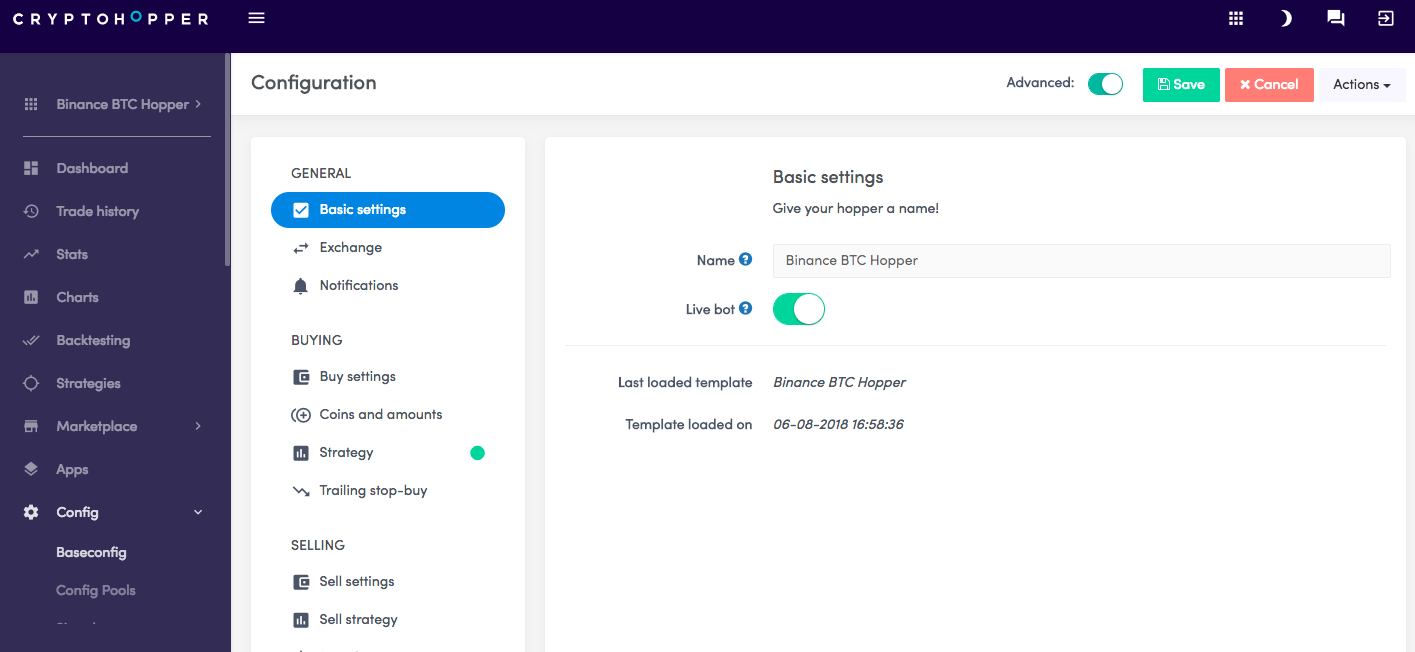
Configure your Hopper
Go to your dashboard at Cryptohopper.com. Click Config
You can fill in your API key and secret key at the bottom and make sure to click save.
Unable to see your exchange balance?
There are several things that prevents your hopper from synchronizing the funds of your exchange. In most cases, the browser that you use has ‘’auto-fill’’ enabled. This means that the browser fills in certain text fields themselves. There are three things you can do:
- Disable autofill,
- Use incognito mode of your browser
- Use a browser that you don’t use often.
Another thing that could prevent your hopper from synchronizing are password managers, disable this for Cryptohopper.
That’s it! Your hopper is ready to trade! Have you already put Bitcoin on your Poloniex account to trade with? If not, check our tutorials page for information about buying Bitcoins. If you want more guidance on this subject, watch our Cryptohopper Academy video about this subject.


_webp.webp)
_webp.webp)