0%
3 Reasons Why Bitcoin Could Test $30,000
#Bitcoin#Cryptocurrency#crypto trading tips+2 více tagů

3 Reasons Why Bitcoin Could Test $30,000

Bitcoin (BTC) has risen to highest price in a month, experiencing a relief rally that has the potential to turn into something more substantial. Let’s explore 3 key technical factors that support the bullish case scenario, and if a potential retest of $30,000 is possible.

Bollinger Bands Hook

The hooking of the Bollinger Bands, when the 2 bands point in the opposite directions, is usually a signal of a significant move ahead. When the price crawls along the upper band, we can expect a sustained upward movement.

In the beginning of May and June, we had a similar signal, but at that time BTC’s price was crawling along the lower band, which led to lower prices.

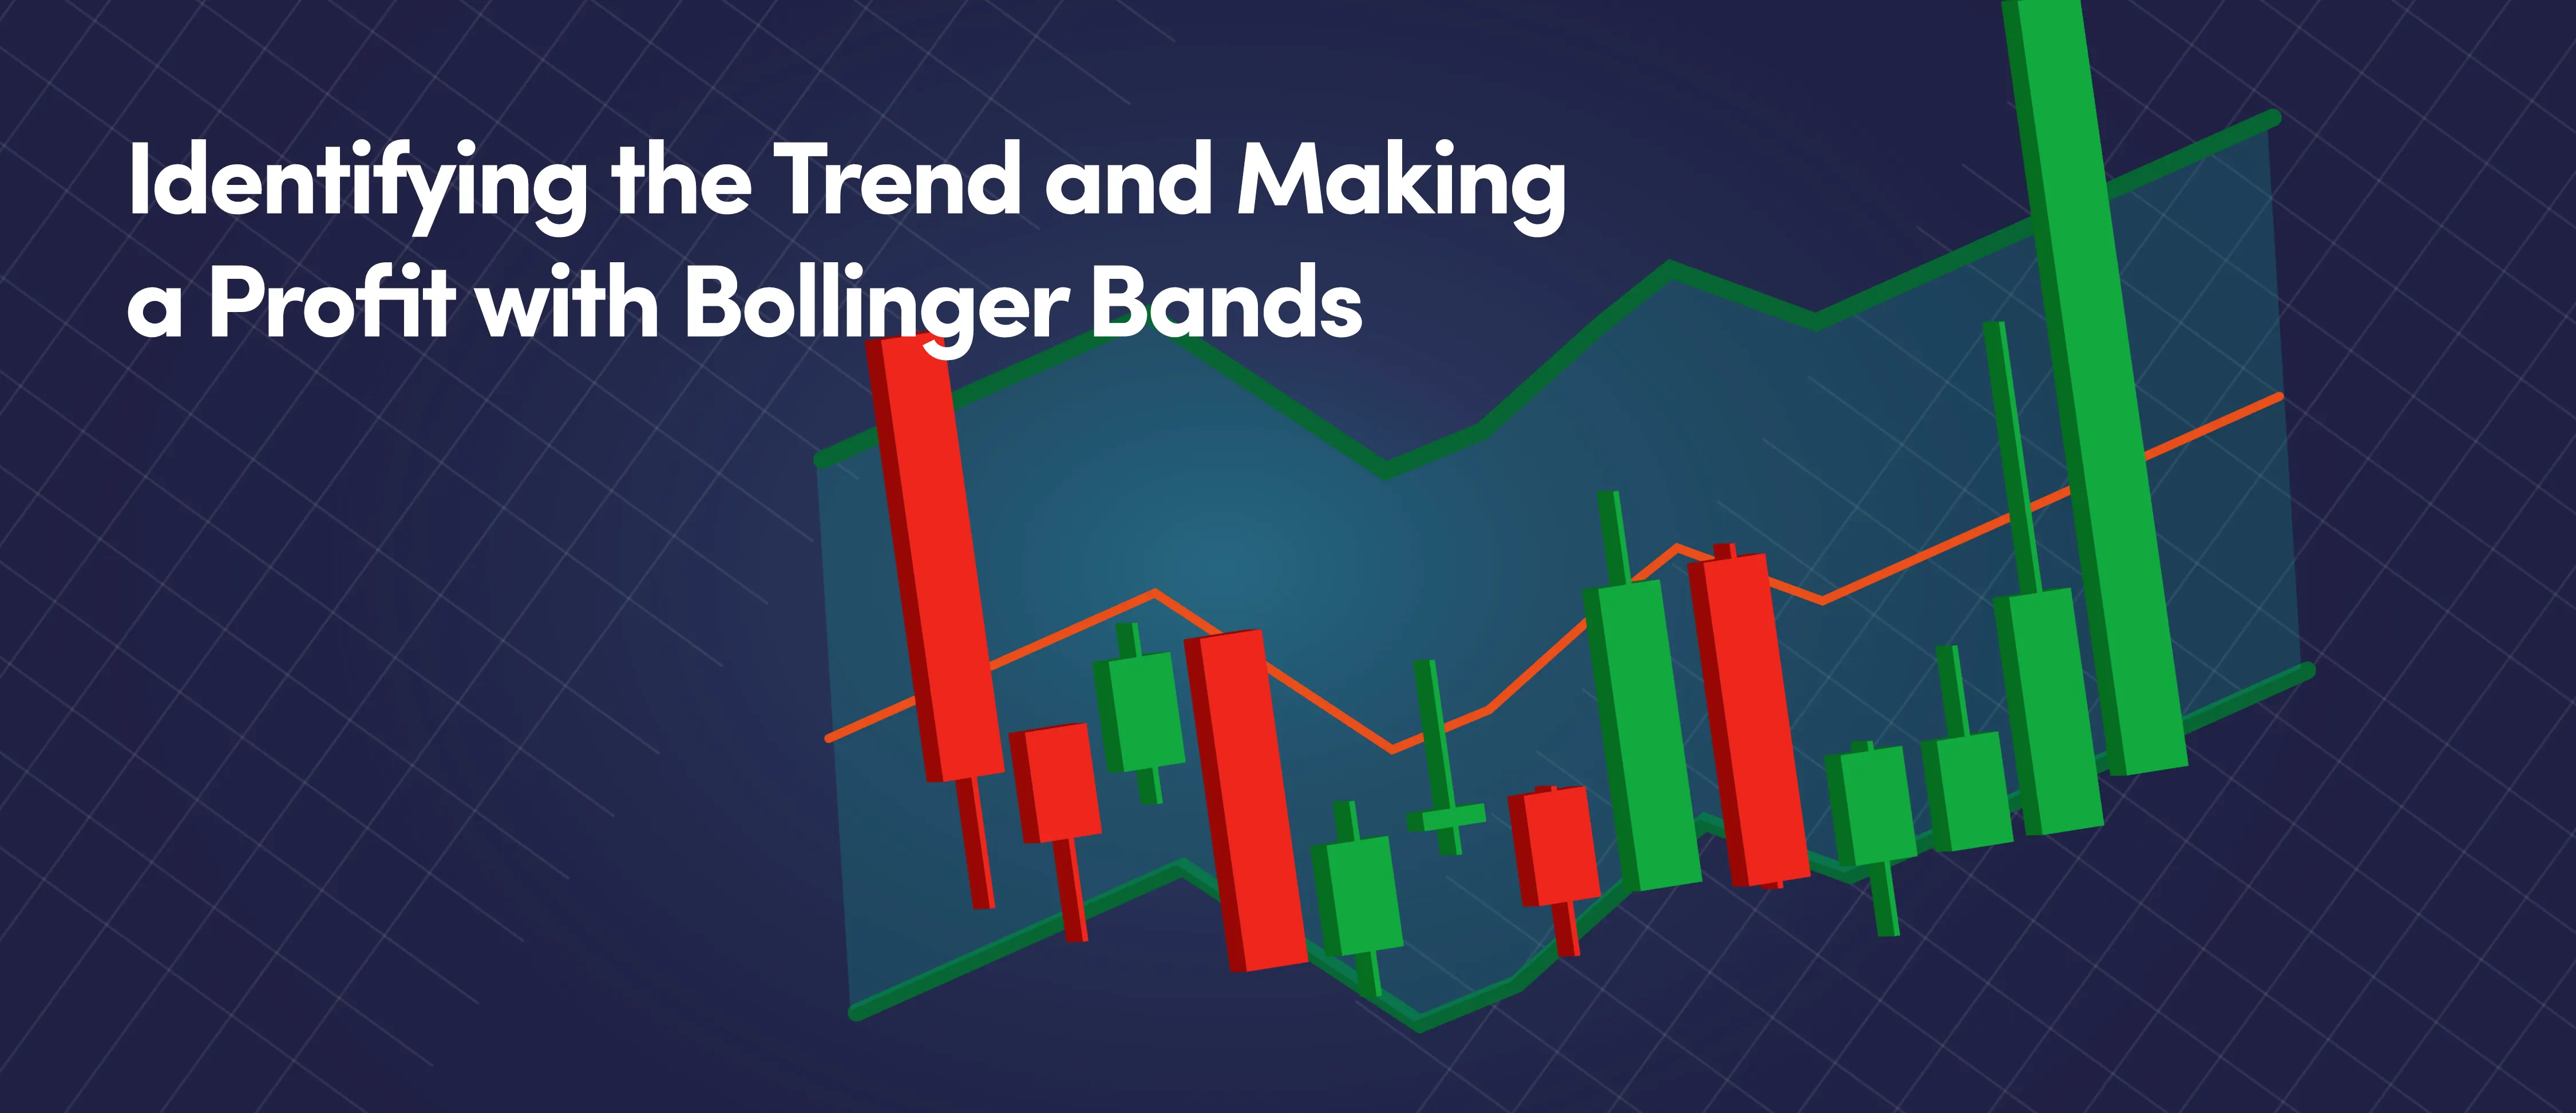
What are Bollinger Bands Hook?

The Bollinger Bands hook is a technical indicator that can be used to identify potential reversal points in the market.

It is created by drawing two lines on a chart. The upper line is typically two standard deviations above the 20-day moving average, while the lower line is two standard deviations below the 20-day moving average.

When the price of an asset reaches the upper Bollinger Band, it is considered overbought, and when it reaches the lower Bollinger Band, it is considered oversold.

Read more about Bollinger Bands in our blog.

Bollinger Bands Bitcoin trading chart

Stair Step Pattern Broken

Bitcoin is also attempting to reverse the stair step pattern that developed during the current bearish cycle. Basically, the stair step pattern develops along with the downtrend, because the price trades sideways for a few days before it breaks down.

The price range of the last consolidation can be used to project the next possible target. In our case, the measured move target could be completed around $28,500.

What is the Stair Step Pattern?

The "Stair Step" pattern is a three-step process that Bitcoin has followed since early 2019. The pattern goes as follows: First, there is a sharp decline in price, followed by a recovery to new highs, and finally, another decline to slightly lower lows.

RSI Oscillator

In terms of the momentum readings, the Relative Strength Index (RSI) oscillator has climbed to its highest reading since April and at the same time, we broke above the 50 mid-level – a positive price development.

Bitcoin’s price still has a mountain to climb, but once the $22,400 resistance level is cleared we have little to no resistance ahead. The next real resistance level only comes at the $28,000, the previous stair step bottom.

Looking forward, the $30,000 target is a big psychological level that Bitcoin has the potential to tag again if the bullish momentum continues.

Obrázek doručené pošty

Newsletter

Získejte týdenní e-mail s exkluzivními kryptoanalýzami a zprávami, které stojí za přečtení. Zůstaňte informováni a bavte se zdarma.

Automatizujte
své
obchodování!

Automatický kryptoměnový obchodní bot světové třídy

Začněme
Automatizujte své obchodování

Související články

Bot Trading 101 | How To Apply a Scalping Strategy
#Automated trading strategy#Strategy designer#EMA+3 více tagů

Bot Trading 101 | How To Apply a Scalping Strategy

Cryptocurrencies | BTC vs. USDT As Quote Currency
#Bitcoin#crypto trading#crypto trading tips+2 více tagů

Cryptocurrencies | BTC vs. USDT As Quote Currency

Technical Analysis 101 | What Are the 4 Types of Trading Indicators?
#Technical analysis#technical indicators#Momentum Indicator+2 více tagů

Technical Analysis 101 | What Are the 4 Types of Trading Indicators?

Bot Trading 101 | The 9 Best Trading Bot Tips
#crypto trading#trading bot#crypto trading tips+2 více tagů

Bot Trading 101 | The 9 Best Trading Bot Tips

Začněte obchodovat se službou Cryptohopper zdarma!

Bezplatné použití - není vyžadována kreditní karta

Začněme
Cryptohopper appCryptohopper app

Odmítnutí odpovědnosti: Cryptohopper není regulovaným subjektem. Obchodování s kryptoměnovými boty s sebou nese značná rizika a minulá výkonnost není indikátorem budoucích výsledků. Zisky uvedené na snímcích obrazovky produktu jsou ilustrativní a mohou být přehnané. Do obchodování s boty se zapojte pouze v případě, že máte dostatečné znalosti, nebo požádejte o radu kvalifikovaného finančního poradce. Společnost Cryptohopper za žádných okolností nepřebírá žádnou odpovědnost vůči jakékoli osobě nebo subjektu za (a) jakoukoli ztrátu nebo škodu, zcela nebo zčásti, způsobenou transakcemi s naším softwarem, vzniklou v důsledku těchto transakcí nebo v souvislosti s nimi, nebo (b) jakékoli přímé, nepřímé, zvláštní, následné nebo náhodné škody. Upozorňujeme, že obsah dostupný na sociální obchodní platformě Cryptohopper je vytvářen členy komunity Cryptohopper a nepředstavuje radu ani doporučení od společnosti Cryptohopper nebo jejím jménem. Zisky uvedené na Markteplace nejsou indikátorem budoucích výsledků. Používáním služeb Cryptohopper berete na vědomí a přijímáte rizika spojená s obchodováním s kryptoměnami a souhlasíte s tím, že Cryptohopper zbavíte jakýchkoli závazků nebo ztrát. Před použitím našeho softwaru nebo zapojením se do jakýchkoli obchodních aktivit je nezbytné prostudovat a pochopit naše Podmínky poskytování služeb a Zásady zveřejňování rizik. Obraťte se prosím na právní a finanční odborníky, kteří vám poskytnou individuální poradenství na základě vašich konkrétních okolností.

©2017 - 2026 Copyright by Cryptohopper™ - Všechna práva vyhrazena.