How Golden Crossover Signal Can Send Tron to $0.10
Tron (TRX) flashed the golden crossover signal, which is widely considered a technical buy signal. The bullish case scenario for this cryptocurrency is also supported by the higher highs and higher lows price structure which signals that an uptrend could be developing.
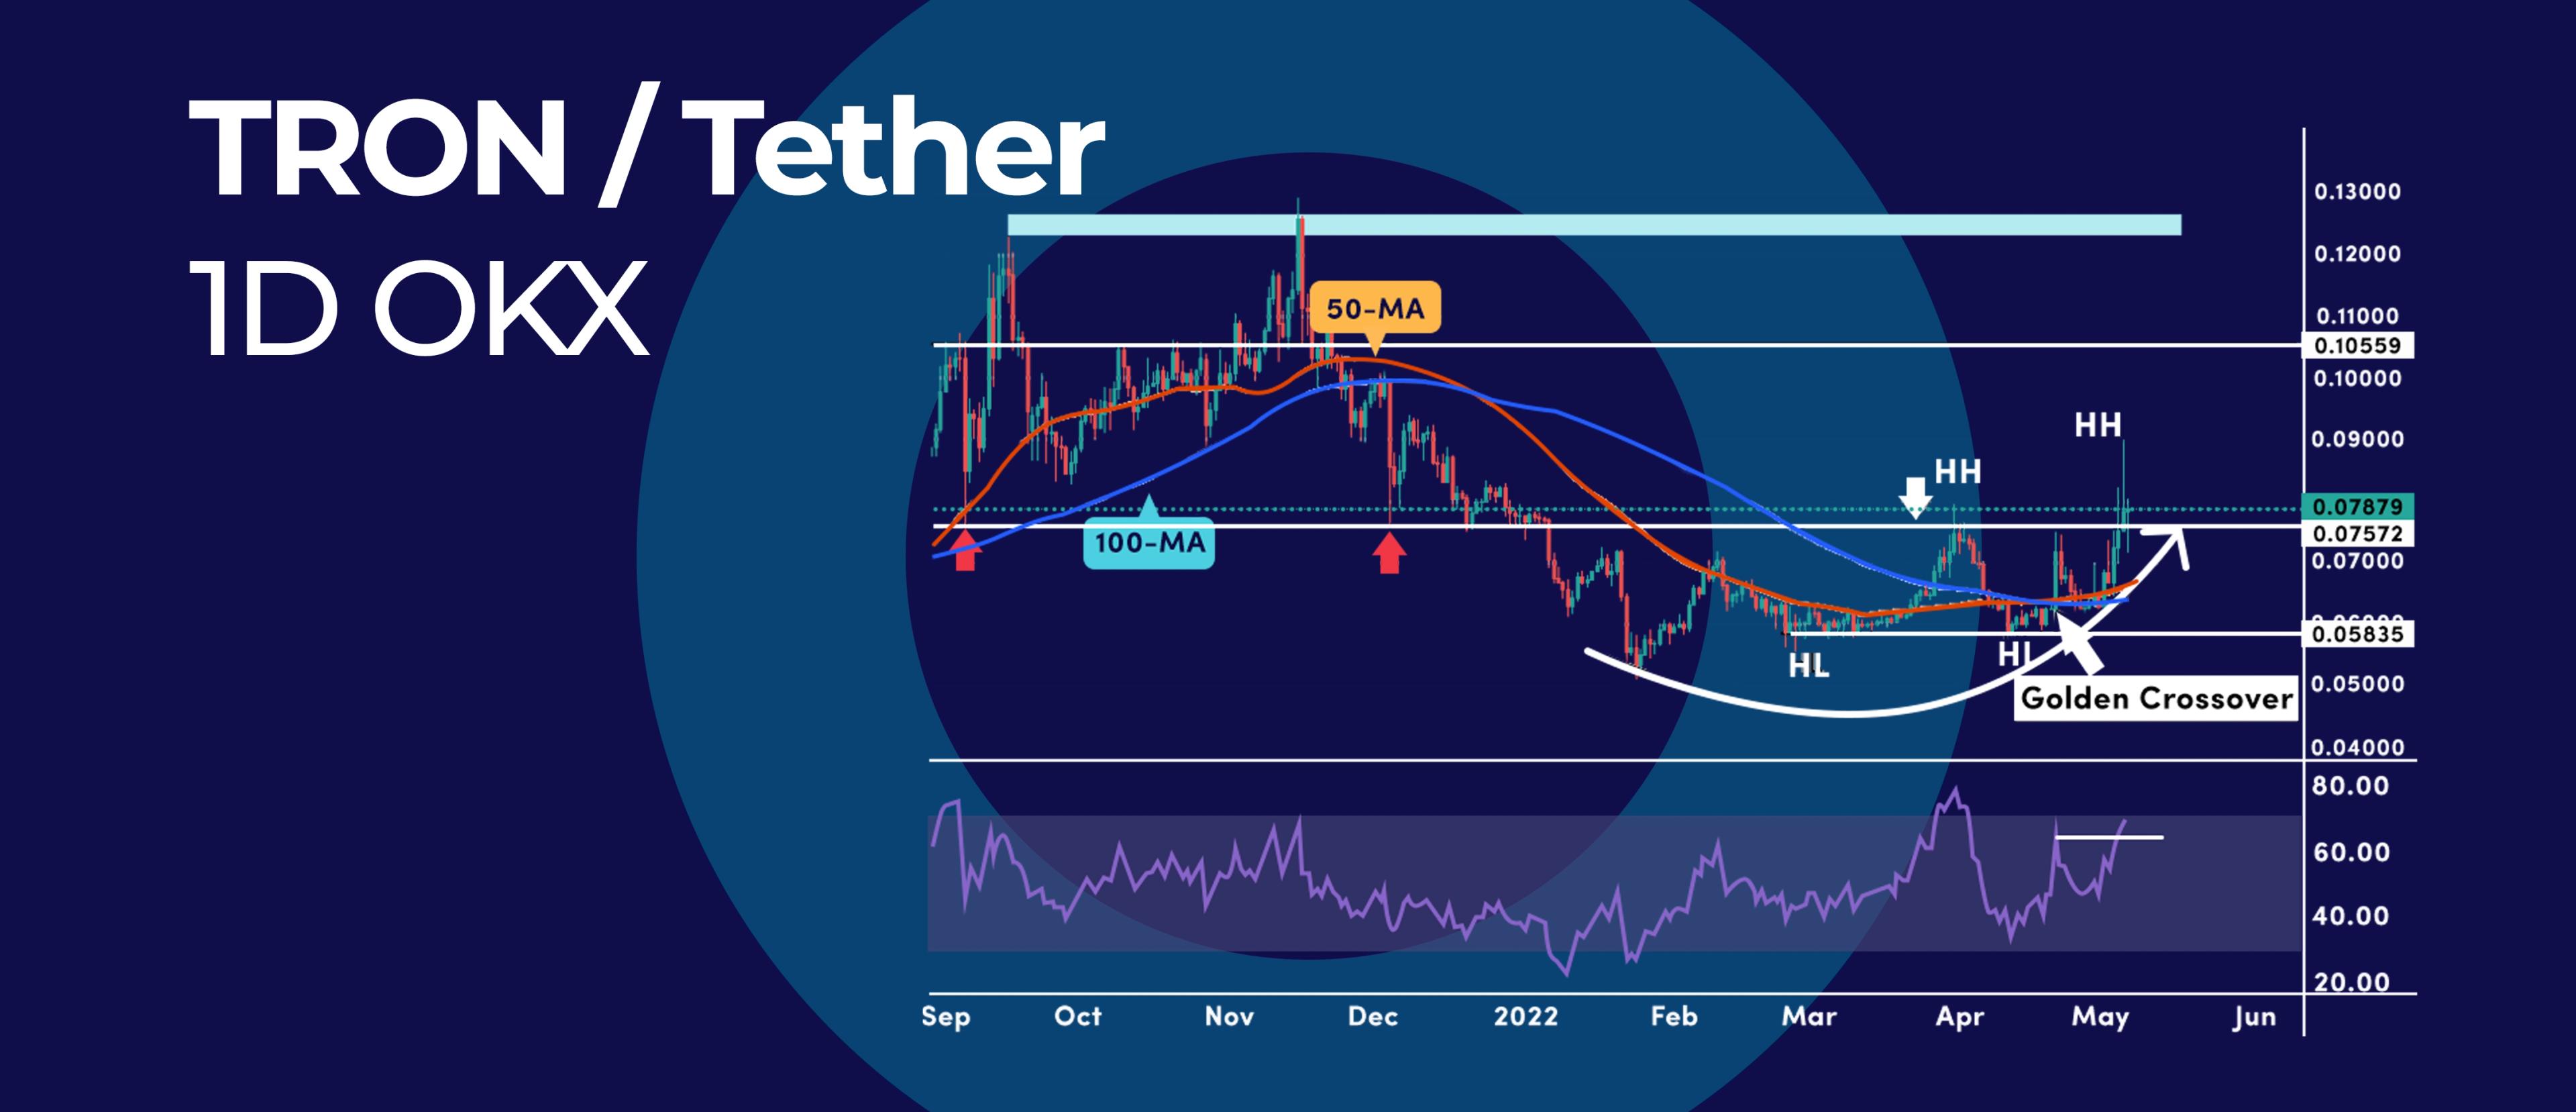
Golden Crossover Signal
Most traders only learn to follow the 50 and 200 Simple Moving Averages (SMA). However, not many traders know that the golden crossover signal can also occur when the 50-day moving average crosses above the 100-day moving average.
Since the 100 period SMA is faster than the 200 periods SMA, we can detect a shift in the general market direction much earlier.
The above chart is the 1D chart of TRON against Tether.
The 50 period SMA is marked with a Orange line, the 100 period SMA is marked with a blue line. On September 27, TRX triggered the golden crossover signal.
Price Structure
TRX's price is now printing a series of higher highs followed by at least two higher lows, which signals that we're starting to move upwards.
Additionally, based on the RSI oscillator, TRX made a new high in momentum readings which confirms the bullish sentiment.
Looking forward: There is not much resistance to the upside until the $0.10 psychological number.
On the flip side, we have a strong support level at $0.058. As long as we stay above this support level, TRX has the potential to reach the $0.10 milestone.
What is TRON crypto and what is it used for
Founded by Justin Sun, TRON is a decentralized content entertainment platform that aims to bridge the gap between content creators and content consumers. The company uses blockchain technology, peer-to-peer (P2P) network and distributed storage technology.
What is a Golden crossover signal
The golden cross is a bullish breakout pattern formed from a crossover involving a security's short-term moving average (such as the 15-day moving average) breaking above its long-term moving average (such as the 50-day moving average) or resistance level.
As long-term indicators carry more weight, the golden cross indicates a bull market on the horizon and is reinforced by high trading volumes.
The term "golden cross" derives from the golden ratio, a number said to be found throughout nature and used by some traders to identify points of change or correction. The golden ratio is calculated as 1.618.
What is a simple moving average
A simple moving average is a trend following indicator that smooths out price fluctuations in order to measure the overall direction of price.
The first step is to calculate the mean (or average) of a set of data. This is done by adding all the values in the set and dividing by the number of values in the set.
Example:
Imagine that the data set is a series of prices for a stock or an exchange-traded fund (ETF). In order to calculate the simple moving average of the last five days, you would add the prices of the last five days and divide the sum by five.
The important thing to know is that only the last five days were used in the calculation. The price from six days ago is ignored.
In order to calculate the next day's simple moving average, you would drop the price from six days ago and add the price from the most recent period.


_webp.webp&w=3840&q=75)
_webp.webp&w=3840&q=75)


