Bitcoin has ground higher for a second week, printing $66,990 on 21 July, 2026, its highest price since mid-June. The price is now up 15.9 percent since the $57,803 current cycle low, recorded on July 1, and up 12.4 percent in July. This aligns with our view that, on a historical basis, there are grounds for a positive July.
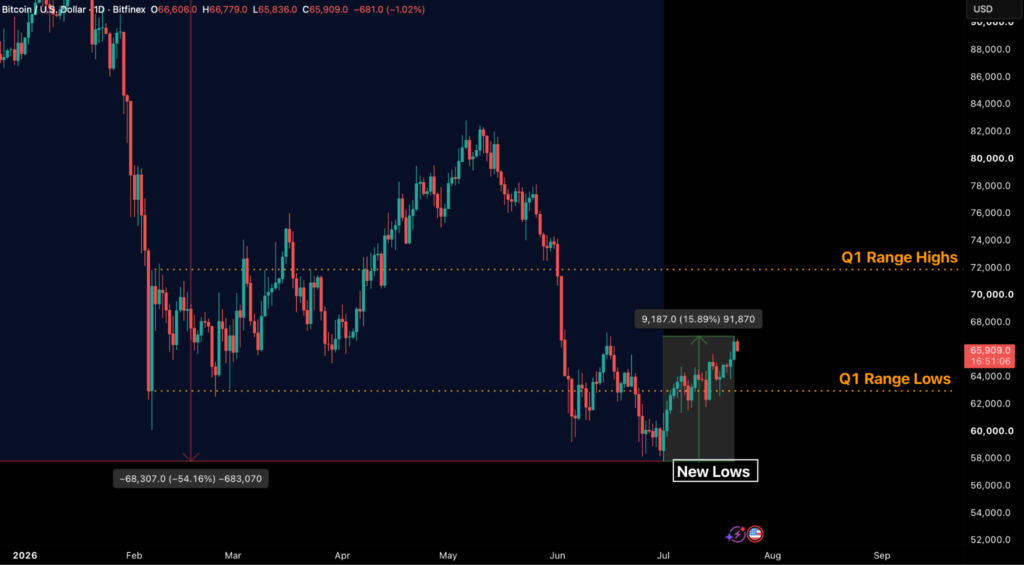
The move has now carried price to the underside of the resistance zone around $68,000, which we have identified as a key decision band that will determine whether the mid-timeframe uptrend continues.
A Grind Higher On Low Volumes
The character of the current move, however, gives us some cause for concern. While the price has recovered in line with expectations, volumes remain well below average, framing the advance against a backdrop of subdued summer activity that currently persists. 30-day bitcoin volumes sit at 62 percent of the annual average, and average daily spot turnover is near $2.3 billion, close to yearly lows. CME bitcoin futures open interest (OI) is at its lowest since 2023, with the absence of a positive basis removing its appeal as a delta-neutral position for TradFi.
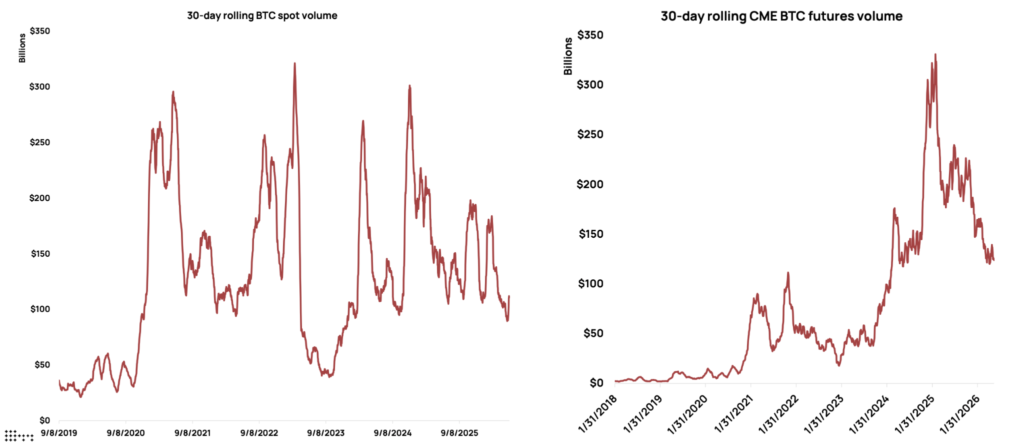
Bitcoin also continues to be less actively traded on multi-year time horizons, which leaves it less liquid and more susceptible to marginal buying or selling, even at smaller sizes.
A market that climbs on thin participation can travel quickly in either direction because there is little resting liquidity to absorb a shift in flow.
Notably, Strategy made no bitcoin purchase or sale for a second consecutive week. Their holdings remain stable at 843,775 BTC. This means the largest single seller of early July has now stepped aside, removing one source of overhead supply and allowing the price to grind higher for now, without immediate sell-side pressure.
Marginal Selling Is Also Absent
The “Relative Long/Short-Term Holder Realised Profit and Loss” metric categorises on-chain sales into four groups: long-term holders (LTH) and recent buyers, each selling either at a profit or a loss.
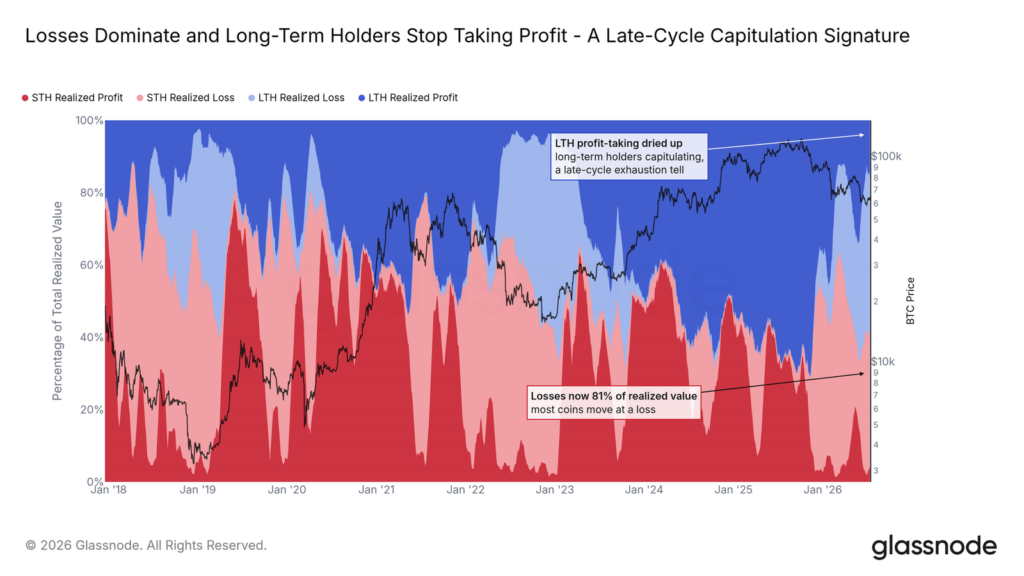
While LTH selling at a profit dominated much of the last bull cycle, that trend has largely ceased, with current sales by this cohort now occurring at a loss. LTH realised profit is at its lowest level since January 2023.
LTH realised loss remains minimal, as this cohort is largely holding its supply. This shift, where losses dominate on-chain activity, is characteristic of a late-stage bear market. The share of selling from LTH has ceased to grow, signalling an end to the persistent selling pressure that capped rallies earlier this year.
Total bitcoin supply held at a loss rose above 50 percent in late June. With the recent price increase, supply previously held at a loss has now moved back into profit. That said, the dominance of bitcoin supply in loss across all cohorts remains an important metric for timing bear-market bottoms.
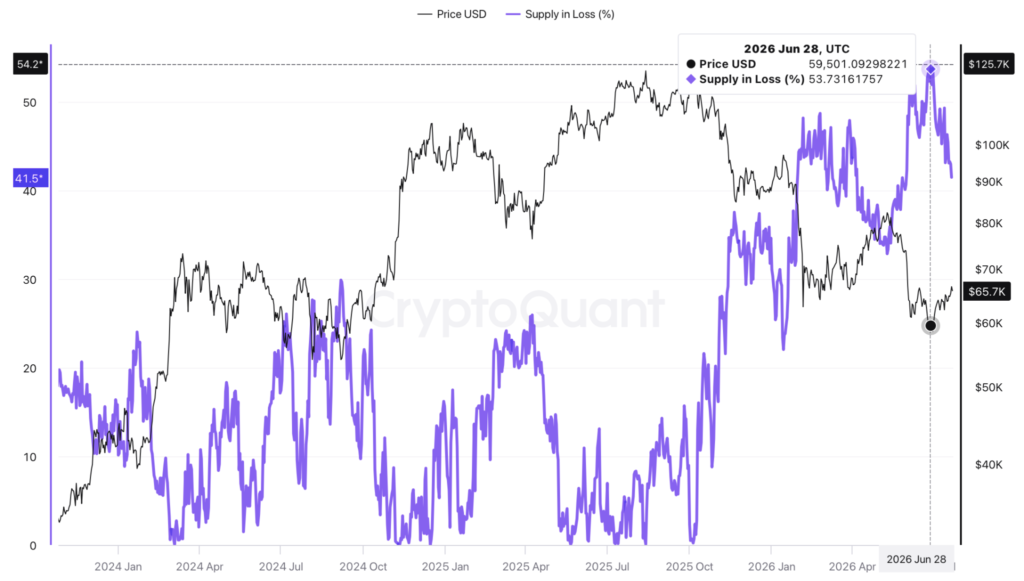
While it is impossible to confirm whether the cycle bottom has occurred, cycle bottoms and the 50 percent supply-in-loss signal typically coincide. In addition, the average one-year forward return from such conditions tends to be strong.
Short-Sellers Retreat
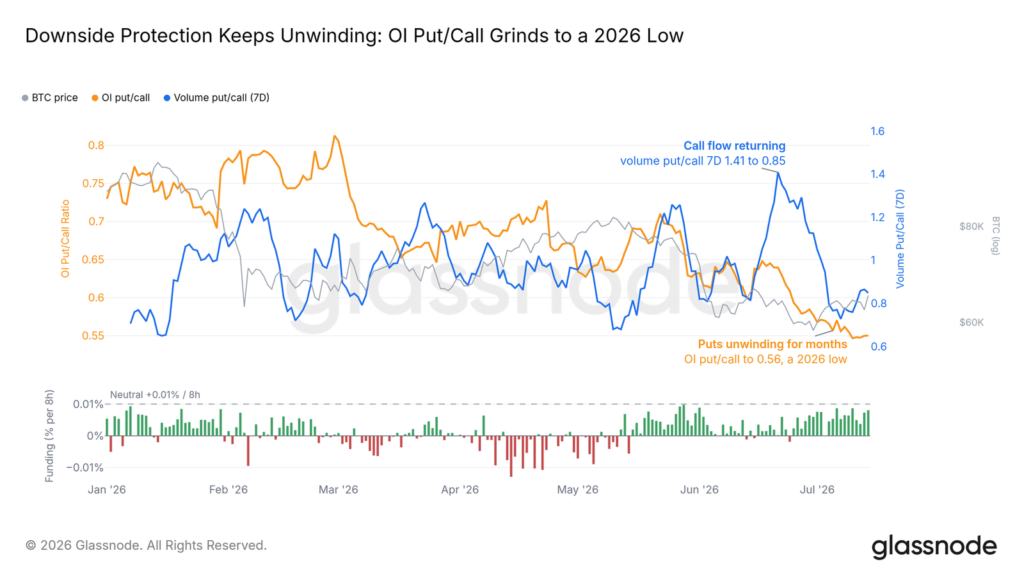
Derivatives positioning has shifted steadily over the past two weeks. With the Options Put/Call Ratio falling to annual lows, market participants are no longer paying a premium for downside protection and are allowing hedges to expire without rolling them forward, as reflected in put open interest drifting lower. Perpetual funding meanwhile remains slightly above neutral, well below the levels associated with a saturated long trade. Short-side conviction is fading, marked by a steady withdrawal rather than a sudden capitulation.
The overall put/call open interest ratio has now moved to 0.56, a multi-month low. Crucially, this structural unwind has not translated into meaningful spot demand. The repositioning of futures and options traders represents a reduction in overhead resistance rather than an influx of fresh capital into the underlying asset.
This lack of aggressive spot participation remains the primary caveat for the durability of the current recovery.
Rotation Without Breadth
On the surface the market is not in an altcoin season. Bitcoin dominance sits near 58 percent, and the Altcoin Season Index reads in the high 40s to low 50s —neutral territory that still favours BTC. A confirmed altcoin season would require bitcoin dominance below 50 to 55 percent and the index above 75. Neither condition is close.
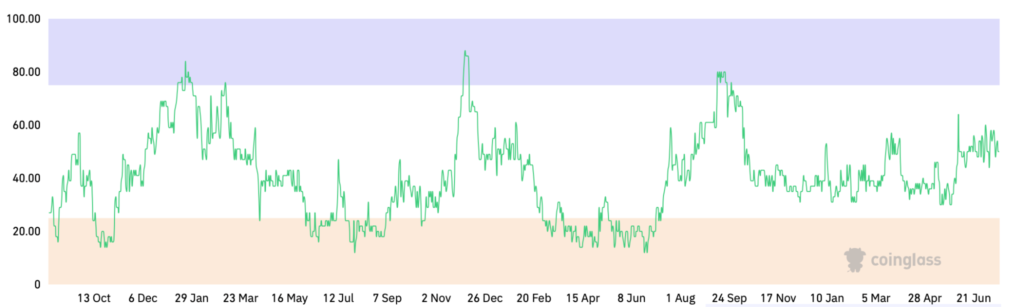 Bitcoin Dominance. Source: Coinglass.
The Altcoin Season Index is calculated by weighing a range of factors including relative performance, trading volume, volatility and market capitalisation.
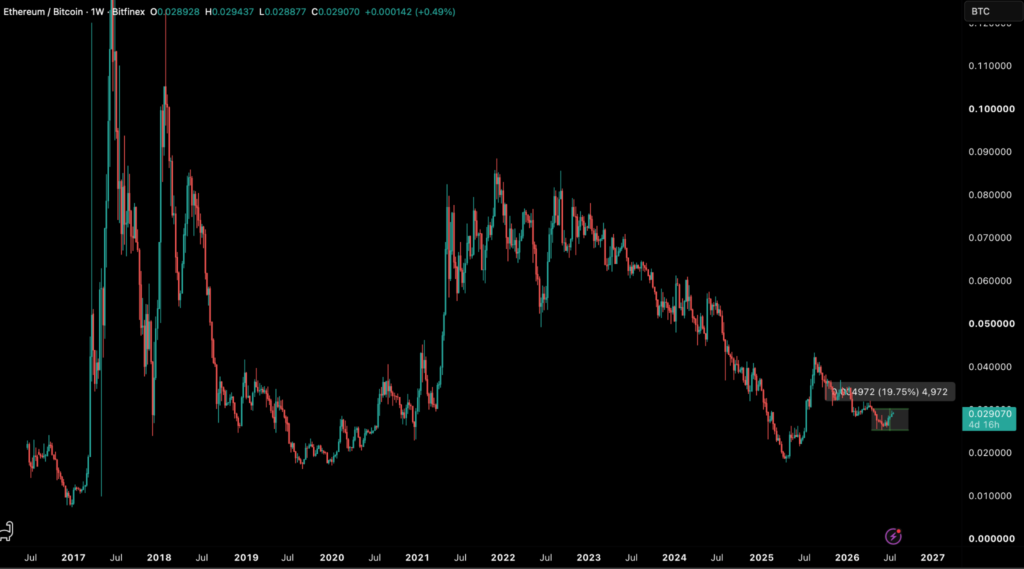
Underneath, however, a marginal rotation has begun, led by Ether rather than the long tail. Ether outperformed bitcoin in mid-July, gaining roughly 11 percent in the week to 16 July and around 20 percent month-to-date. Arguably for the first time since the Exchange Traded Fund (ETF) launch, institutional flow followed. Spot ETH ETFs drew $105.44 million in the week to 17 July against $75.67 million for spot BTC ETFs, with BlackRock’s ETHA taking $135.31 million.
The ETH/BTC ratio is lifting off a multi-year low, which points to rotation from a deeply depressed base rather than a late-cycle acceleration.
Breadth, however, is the relevant qualifier here. On 20 July, bitcoin and Ether ETF products together captured about 98 percent of the $271 million that entered digital-asset ETFs. The XRP, SOL and HBAR products combined took less than $6 million, and the Hyperliquid fund saw net outflows on the week. For now, the rotation is concentrated in between BTC and ETH, well short of the retail-fuelled, high-dispersion altcoin season the index is built to detect.
Decoupled From the Rates Trade
June inflation numbers released last week were a soft print of historical relevance and pulled near-term hike odds sharply lower. But the long end is signalling that the market’s inflation concerns are still there. The 30-year bond is still above 5 percent.
A hawkish surprise would land on a market that has climbed higher on thin volume, the configuration most exposed to a fast unwind.
We expect a combination of perpetual OI levels, ongoing flows into ETFs, and the $68,000 retest to set the next directional leg, in that order of importance.
Treasury yields recovered modestly over the past week, after the soft inflation print surprise had caused them to pull back sharply. The 2-year bond went from 4.13 to 4.21 percent, the 10-year from 4.55 to 4.6 percent and the 30-year holding above 5 percent at 5.11 percent into 20 July, while US equities sat near record highs.
Bitcoin rose alongside a firmer long end rather than in response to falling yields, which tells us the advance is positioning-led and crypto-internal rather than a bet on easier policy. That decoupling is the risk into next week’s Federal Open Market Committee (FOMC) decision.
Key Levels at a Glance
Metric
Reading
Bullish signal
Bearish signal
$68,000 wall
Spot ~3% below
Acceptance and hold above
First-retest rejection
STHRP
$67,973
Reclaim flips buyers to profit
Sellers cap the move
Derivatives
OI $21.2 to $23bn; funding +4.5%
Spot leads next leg
Funding >15% into rally
ETF flows
+$727.3m, five sessions
Streak extends through FOMC
Three red sessions
Altcoin breadth
Dominance ~58%; ASI ~47-52
Dominance rolls, breadth widens
ETH-only, tail starved
On-chain floor
Realised Price $52,861; MVRV 1.209
Holds as support
Loss on macro shock
The post appeared first on Bitfinex blog.