What the data confirmed
In last week’s Bitfinex Alpha Intelligence Update, The Floor That Broke, we highlighted the ‘air gap’ present below $72,000, a thin band of realised-price distribution that offered no historical support, and which has become the key market feature behind BTC’s current velocity. That gap has now closed in full. As BTC fell over the last 7 days, it did not even pause at the $65,000 level, eventually printing a low of $59,200 on 5 June, the first time price traded under $60,000 since 2024.
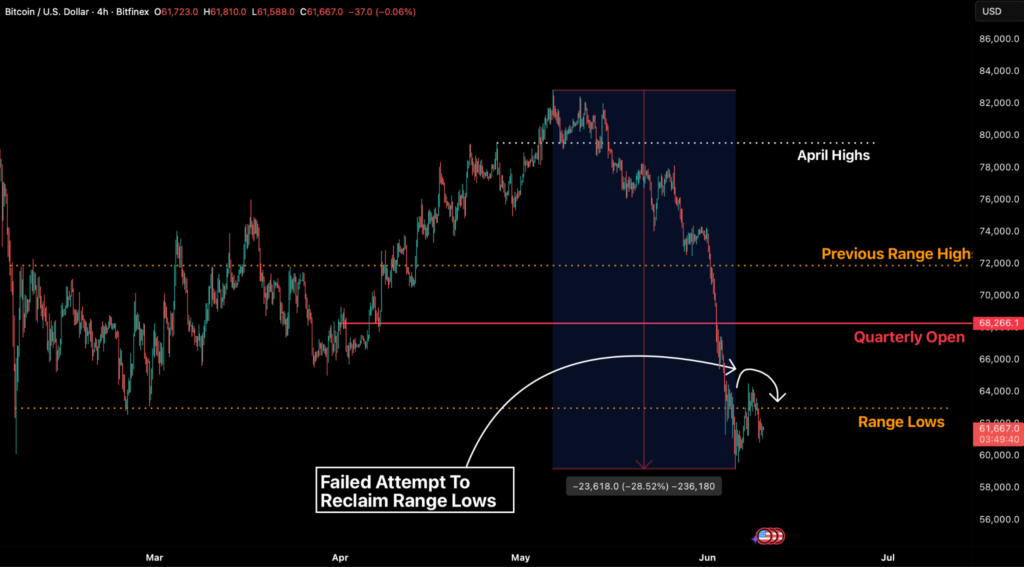
Despite a mechanical bounce over the past few trading sessions, and a general recovery in tech stocks and equities, BTC failed to reclaim even Q1 range lows and continues to trade beneath them. BTC has now turned negative for the quarter.
Anatomy of a Fall
The move down marks a peak-to-trough drawdown of roughly 29 percent from the late-May high at $82,818, and is the deepest correction since the February lows. The descent was not orderly. Between 2-6 June, more than $5.9 billion in perpetual futures positions were liquidated across derivatives venues, with roughly 85 percent of the damage falling on longs.
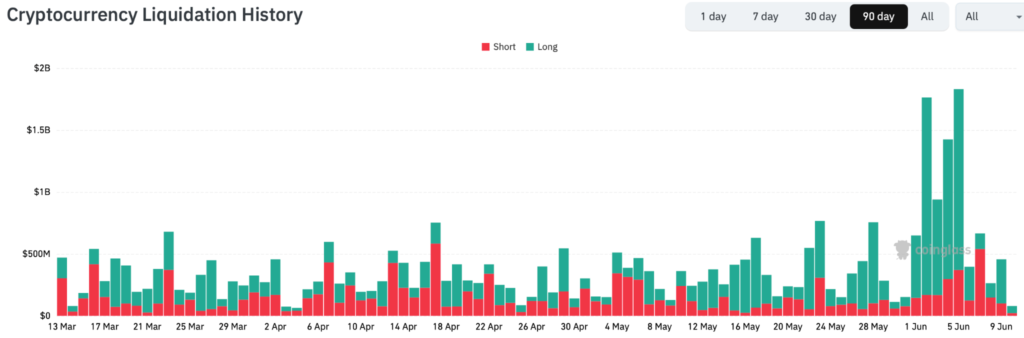
The initial decline since the June monthly open mostly drove large liquidations on BTC trading pairs, while altcoins held up relatively well. Once the $62,000 range lows broke however, altcoins caught up with BTC price action and bore the brunt of long liquidations from 4 June onwards.
The 5 June session alone wiped out around $1.46 billion in longs, after the price broke $62,000 the day before. This was the forced-selling phase we warned could take place, given the thin order books beneath $72,000. The leverage that built on the way down was flushed on the way through.
The Exit of the Institutional Seller
The primary mechanical driver of the recent downside has been the spot Exchange Traded Fund (ETF) complex. The negative flow streak has extended to 13 consecutive sessions, the most prolonged run of outflows since the products debuted in January 2024. Approximately $4.3 billion has been drained from ETFs between mid-May and 3 June. BlackRock’s IBIT bore most of the pressure, accounting for roughly $3.3 billion, or three-quarters of the aggregate exit. The streak finally ended on 4 June, aligning almost perfectly with the $59,200 local low.
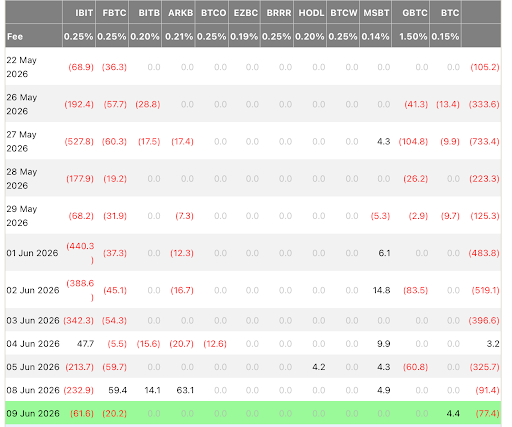
That said, there’s no follow-through bid. The three trading sessions since have continued to record net outflows, even as the BTC corporate treasury narrative appears to have steadied.
Strategy, whose modest 32 BTC sale to cover a dividend, had prompted a reassessment of the treasury bid for bitcoin, demonstrated its conviction for BTC remained unchanged with a subsequent purchase of an additional 1,550 BTC, financed by $181 million in equity issuance. Strategy now has 845,256 BTC on its balance sheet. In addition, at the 8 June annual meeting of shareholders in STRC, Strategy’s perpetual preferred stock, a motion was approved to move from monthly to semi-monthly dividend distributions, with the first payment scheduled for mid-July. With liquid reserves reported near $1 billion as of 9 June, the funding mechanism for more BTC purchases, appears to have stabilised.
The key concern now is the narrative that STRC dividend payments might be funded through BTC sales, which would erode trust in the product’s governing model. Broader distribution from yield products or company treasuries is a secondary issue.
Macroeconomic Forces Transition to Headwinds For Bitcoin
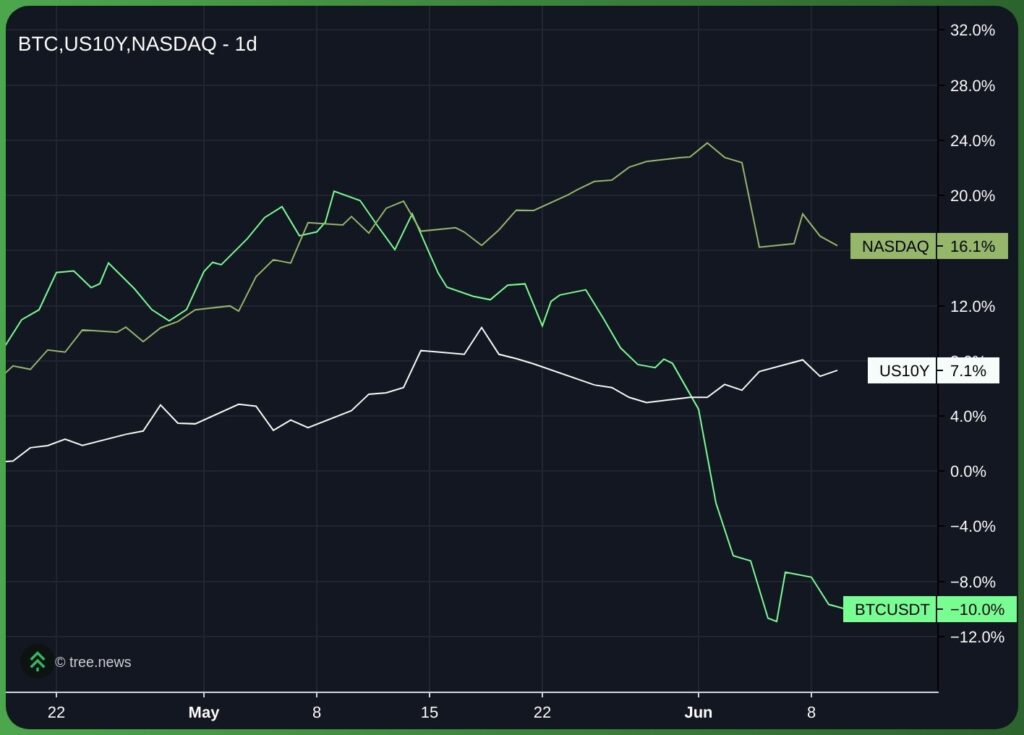
The most significant shift since our previous report is that the broader market narrative has moved beyond pure flow mechanics. A week ago, we noted that Treasury yields were softening, even as BTC prices continue to fall, suggesting the sell-off in BTC was non-macro in nature. That thesis no longer applies. Strong US labour data released late last week, has pushed the 10-year yield higher and effectively priced out the likelihood of an imminent rate cut, diminishing the relative appeal of non-yielding assets and giving investors with first-quarter profits a reason to de-risk.
This repricing places considerable weight on the upcoming Federal Open Market Committee (FOMC) meeting from 16 to 17 June. The market expects the Fed to hold rates at the 3.5-3.75 percent target range for a fourth consecutive meeting, so the real volatility risk lies in the Summary of Economic Projections. A “dot plot” that signals a more hawkish stance for the rest of the year would likely validate recent yield moves and sustain pressure on ETF demand. By contrast, a dovish pivot, or commentary acknowledging slowing growth would offer the clearest path towards a reversal of current outflows.
Analysing Conviction versus Flow Mechanics
As newer BTC market participants face compression below the lower boundary of the quarterly range, active loss realisation is extending. The drawdown below range lows has pushed aggregate Realised Loss to a daily pace of $1.35 billion, a marked acceleration from the baseline set during the prior consolidation.
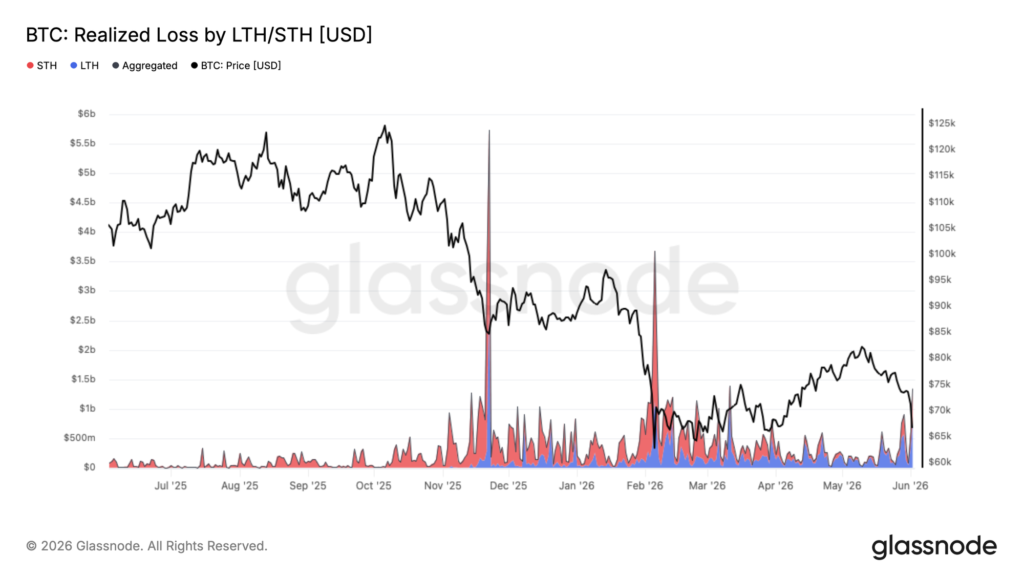
Approximately $770 million in sales per day now comes from long-term holders who built positions before January 2026. That points to steady capitulation among those who bought near local peaks, as the sell-off extends beyond short-term holder profit-taking and into long-term holder distribution. The remaining selling comes from more recent entrants who accumulated between $67,000 and $82,000 during 2026, and who are now compelled to de-risk as market prices fall below their cost basis.
Bottom line: As this correction matures, the transfer of supply from long-term holders to newer hands at discounted prices remains a necessary part of the bottoming process. Yet the current pace of loss realisation suggests this structural flush isn’t yet complete.
Aggregate ETF cost basis, along with other cost-basis metrics such as the True Market Mean (TMM) and Short-Term Holder Realised Price (STH-RP), all lie above $75,000. They’re unlikely to fall unless these cohorts begin buying at current prices, pulling their aggregate cost basis down. A primary reason for the move lower after price stalled above $80,000 was that many holders saw the price reclaim their cost basis before deeper declines, then capitulated or reduced exposure on the way down.
The same dynamic needs to take place with a sustained bid from one of the marginal buyers we have outlined, to drive a sharp move higher. Weaker buying is likely to be sold into as price re-approaches cost basis metrics that now act as resistance.
The Catalyst Scorecard: A Mid-June Update
We originally established eight performance benchmarks on 3 June. One week on, the picture is mixed: three bearish triggers fired during the air gap descent, while two have turned bullish following the leverage washout and Strategy’s re-entry.
Trigger
June 3 Baseline
June 10 Status
Current Outlook
ETF Demand
10-day outflow streak; bearish if it persisted.
Total of ~$4.3bn lost over 13 sessions. Streak broke at the 5 June low. 8 June: -$91m.
Bearish impact confirmed; now stabilizing.
STRC Parity
Trading below par; risk of forced liquidation.
Accumulation resumed via ~$181m issuance. Dividend risk mitigated. Trading at $97, close to par.
Bullish reversal; overhang removed.
Leverage
Neutral funding; open interest lean.
Massive $3bn flush 4-6 June. Longs wiped. OI significantly reset.
Bullish; downside fuel exhausted.
Liquidation Clusters
Major long clusters exposed below spot.
Cascade completed to $59,070. Remaining clusters are negligible.
Bearish trigger fully executed.
Cost Basis
Price under $76.5k accumulator avg.
Current spot ~$62k; unrealised losses are expanding for new entrants.
Bearish trend persists.
Demand Base
Testing $65k-70k; bearish if $65k fails.
$65k broken; $59k-60k now attempting to form a new foundation.
Old floor lost; New Base In Formation
Holder Flow
LTH supply at 16.3m; no exit footprints.
LTH Distribution begins for the first time since Q1 lows.
Structural bullishness lost.
Macro / Rates
Yields easing; move read as mechanical.
Labour strength revived yields. FOMC 17 June is the critical pivot.
Now a primary headwind.
Probability Scenarios and Forward Catalysts
We’re shifting our outlook towards a more balanced split between base and bull outcomes, away from last week’s bearish skew. This adjustment is rooted in market structure: two of the three dominant downward forces, over-leveraged positions and the Strategy overhang, have cleared. The immediate trend now rests on the return of ETF demand and the 17 June FOMC outlook.
Bull case: 35 percent. Contingent on a return to positive weekly ETF net flows alongside a dovish FOMC tone. Target: reclaim $65,000, with scope to extend towards $68,000 to $72,000 over a two-to-three-week horizon.
Bear case: 30 percent. Triggered by renewed aggressive outflows and a daily close below $59,000. Path: a move down towards the $55,000 to $56,000 support, testing institutional cost bases from Q1.
Base case: 35 percent. Expect range-bound trade within the $59,000 to $65,000 band through the 17 June FOMC. Cleared leverage and renewed corporate buying should provide support, while macro uncertainty caps immediate upside.
Bottom line: while structural pressure has lessened, the burden of proof remains on market participants. With the leverage flush complete and mechanical selling paused, the market needs a sustained return of ETF inflows for confirmation. Until then, the current levels are best read as a base under test, with a definitive floor still to be confirmed.

The post appeared first on Bitfinex blog.