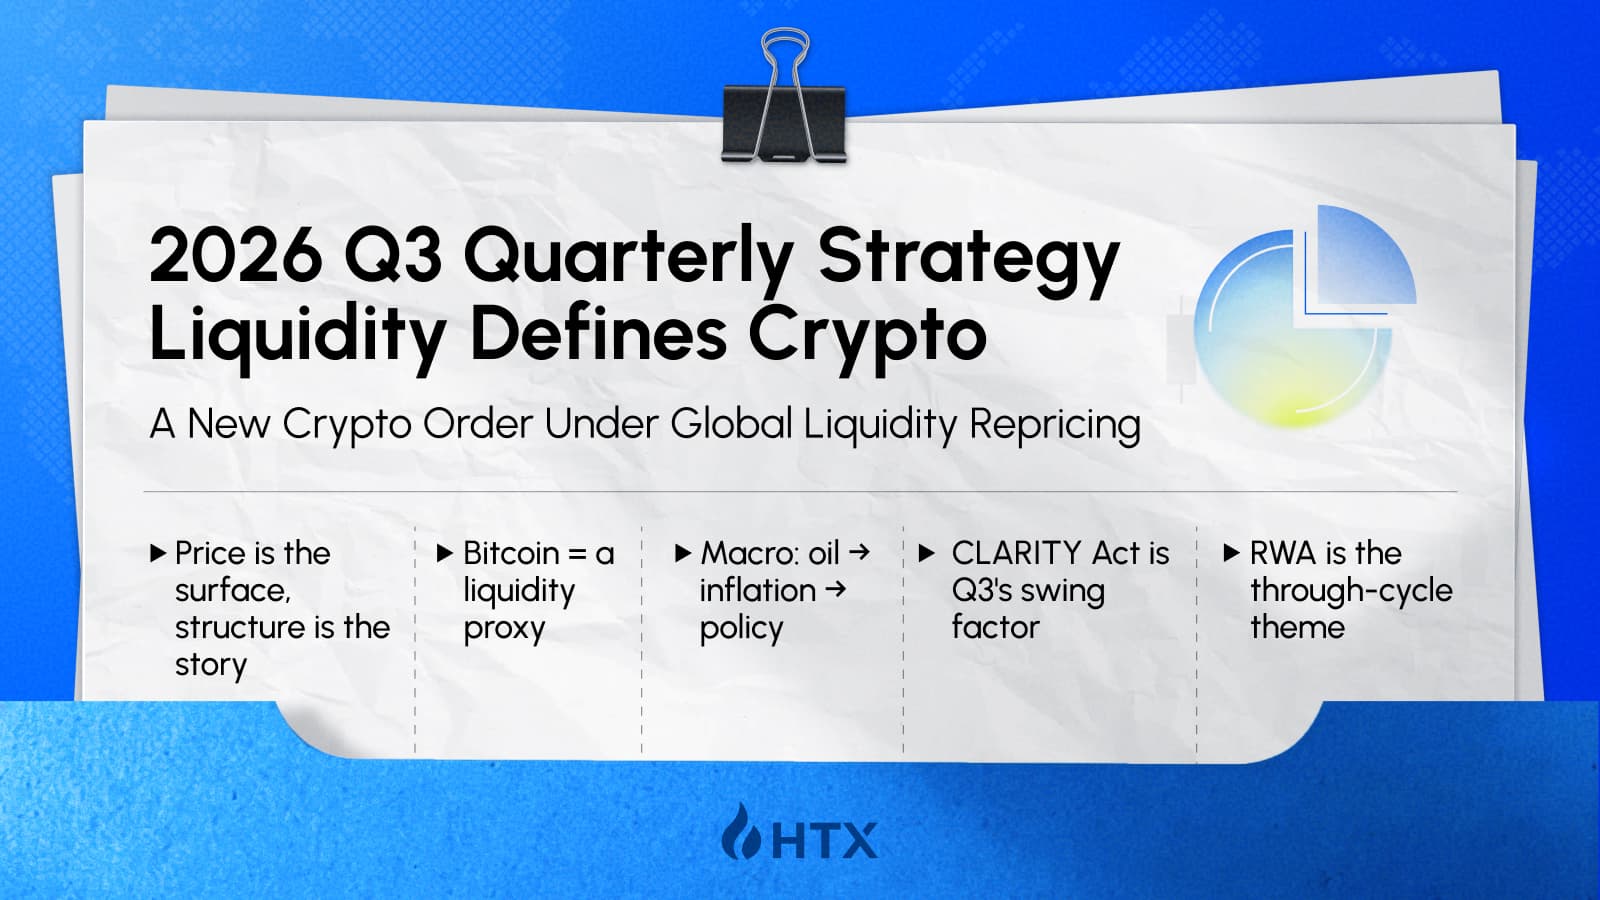
Investment Memo Q2 in One Sentence
Q2 was not the end of the crypto cycle. It was a concentrated repricing of global liquidity, institutional allocation logic, and on-chain value capture.
Price correction was only the surface. What changed underneath was the cost of capital, dollar liquidity, regulatory expectations, and market risk appetite. BTC’s Q2 drawdown did not invalidate the long-term allocation case. It reconfirmed that when ETF flows turn negative, corporate treasury demand slows, derivatives leverage is flushed out, and the dollar and real yields rise together, crypto assets still obey the global liquidity cycle first.
Three Things We Believe
1. Liquidity matters more than geopolitics.
Geopolitical events can change short-term risk appetite, but global dollar liquidity still determines BTC’s trend. The real impact of the Iran war, oil prices, and renewed inflation pressure was not the safe-haven narrative itself, but the way they changed the Fed reaction function, dollar strength, and risk-asset valuation.
2. Cash flow matters more than narratives.
The Q2 divergence across ETH, DeFi, and altcoins shows that the market is no longer willing to pay high valuations for narrative alone. Ecosystem activity, TVL, and user growth must translate into fees, revenue, burn, yield, or clear token-level value capture. Otherwise, growth is not enough to support valuation.
3. Infrastructure matters more than price.
Price weakness did not stop infrastructure expansion. RWA, stablecoin settlement, tokenized equities, AI-agent payments, and institutional compliance rails continued to develop. Crypto’s long-term direction is shifting from a market for trading native assets to part of the global financial infrastructure stack.
Three Things to Watch in Q3
Fed
The key macro variable is not a single meeting, but whether the Fed continues to defend a hawkish reaction function. If inflation expectations do not fall, the market will continue to price “higher for longer,” limiting risk-asset multiple expansion.
Treasury
QT is no longer the main source of marginal liquidity drain. With the RRP buffer nearly exhausted, TGA rebuilding, Treasury issuance, and bank reserves will become the key variables for risk-asset liquidity.
CLARITY
Regulatory clarity is the largest policy variable in Q3. If the CLARITY Act continues to advance, ETH, DeFi, stablecoins, and RWA should have higher beta to regulatory repricing than BTC.
Three Strategic Views
Asset / Sector
Q3 View
Core Rationale
BTC
Overweight
Global liquidity proxy and the primary institutional entry point into crypto
ETH
Neutral / Tactical Long
Valuation has compressed, but a recovery needs confirmation from ETF flows, fees, and regulation
Quality DeFi
Selective Overweight
Regulatory progress and improving cash-flow capture may drive a rerating of leading protocols
RWA
Overweight
High-rate environment and institutional compliance demand support structural growth
Long-tail Altcoins
Underweight
Stablecoin expansion is insufficient; unlocks and liquidity constraints remain
HTX Research View
We do not predict prices. We explain what drives them.
HTX Research’s core view is that the Q3 crypto market will not be driven by a single narrative. It will be jointly determined by whether global liquidity improves at the margin and whether regulatory clarity is sufficient to reopen institutional risk budgets.
Executive Summary
1. Q2 was a liquidity repricing, not a cycle breakdown
The Q2 correction was driven by four forces: a hawkish Fed pivot, dollar strength, a reversal in ETF flows, and weaker corporate treasury demand. BTC fell rapidly after its mid-May local high and entered a low-range consolidation in June. The move was fundamentally a repricing of the global cost of capital.
This was not a classic industry-level collapse. During the price correction, RWA, stablecoin settlement, tokenized equities, and institutional compliance infrastructure continued to expand. The drawdown was concentrated in asset prices rather than infrastructure adoption.
This distinction matters. The last bear-market crisis was driven by credit collapse and institutional trust damage. This correction was driven by higher funding costs and disappearing marginal buyers. The former was endogenous to crypto; the latter was a macro repricing cycle.
Key Numbers
- BTC reached a local high of roughly $82,000 in mid-May and fell to around $59,000 in June, implying a peak-to-trough valuation compression of about 24%.
- Spot BTC ETF flows turned from inflows to outflows in mid-May, with May and June combined net outflows approaching $4.9 billion.
- Tokenized RWA excluding stablecoins rose from roughly $29.49 billion to $32.28 billion, with tokenized Treasuries remaining the main source of growth.
- The CLARITY Act moved through committee and entered the pre-floor-vote stage in the Senate; whether it advances before the August recess is a core Q3 policy variable.
2. BTC has become a global liquidity proxy
Q2 further confirmed that BTC is increasingly priced not as a direct geopolitical hedge, but as a global liquidity asset. In the early phase of the Iran war, gold outperformed BTC, indicating that traditional safe-haven capital still prefers gold. BTC, by contrast, traded more closely with equities and other risk assets, reflecting its integration into the same institutional liquidity pool.
This is not a failure of the BTC narrative. It is the natural result of maturity. ETFs, institutional accounts, corporate treasuries, and macro funds have moved BTC from a crypto-native asset into a cross-asset portfolio instrument. Its key variables are now the dollar, real rates, TGA dynamics, and global risk budgets.
3. ETH’s problem is value capture, not ecosystem activity
ETH underperformed BTC in Q2 because the market began to question whether ecosystem growth can translate into value for ETH holders. Layer2 scaling improved transaction efficiency but reduced L1 fee capture. Stablecoin activity grew more on lower-cost networks such as Tron, Solana, and Base. Staking yields were not attractive enough relative to high Treasury yields. ETH ETFs and staking ETFs have not yet created sufficient institutional depth.
ETH’s valuation framework is changing. The market is no longer paying only for the broad “smart contract platform” narrative. It now requires clearer revenue, burn, yield, and fund-flow evidence. A Q3 ETH recovery depends on improved L1 fees and burn, renewed ETH ETF inflows, and regulatory progress that makes DeFi and staking assets more allocatable.
4. DeFi is entering the era of cash flow and risk management
Q2’s divergence among blue-chip DeFi protocols shows that the market is moving from TVL-based valuation toward cash-flow valuation. Uniswap’s fee-switch path, Sky’s RWA-driven revenue, and Aave’s risk-governance reforms all show that leading protocols are becoming specialized financial entities rather than generic infrastructure layers.
Token prices have not fully reflected this shift because the market still treats DeFi governance tokens as high-beta risk assets rather than financial assets with clearer cash-flow discounting. Security events such as the Kelp DAO incident raised the risk discount on composability. The next DeFi rerating will not come from TVL growth alone, but from sustainable revenue, effective risk isolation, and clear token-level value capture.
5. RWA is the structural theme that can cross cycles
RWA continued to expand in Q2 and remains the clearest structural theme of the quarter. In a high-rate environment, tokenized Treasuries and on-chain money-market products offer a natural yield destination for stablecoin capital. Institutional investors entering crypto are not necessarily buying high-volatility tokens first; they are more likely to allocate to compliant, transparent, custodied, auditable on-chain dollar assets.
This makes RWA different from traditional altcoin narratives. RWA growth does not depend on bull-market sentiment. It depends on real rates, compliance rails, and institutional allocation demand. Even when crypto secondary markets are under pressure, RWA can continue to grow through the cycle.
6. Regulation is replacing narrative as a valuation variable
The advance of the CLARITY Act shows that U.S. digital-asset regulation is shifting from enforcement-led to legislation-led. Final passage still depends on Senate math and political negotiation, but the direction has changed.
For the past several years, markets traded narrative uncertainty. Going forward, they will trade regulatory certainty. Stablecoins, DeFi, ETH staking, RWA, and tokenized securities all need clearer legal frameworks before they can move more deeply into institutional balance sheets. If the CLARITY Act continues to advance in Q3, the marginal beneficiaries may not be BTC, but ETH, DeFi, stablecoins, and RWA, where regulatory discounts remain larger.
Chapter 1: The Great Repricing
How Liquidity Repriced Crypto in Q2
Thesis
The Q2 crypto correction was a global liquidity repricing, not the end of the industry cycle.
BTC’s drawdown, ETH/BTC weakness, the divergence between DeFi fundamentals and token prices, and broad altcoin pressure can all be traced to the same driver: higher funding costs, tighter dollar liquidity, lower risk budgets, and a market-wide reassessment of assets without stable cash flows.
The most important Q2 macro transmission chain was not “war caused crypto to fall.” It was: energy shock → higher inflation expectations → hawkish Fed → stronger dollar → tighter global liquidity → crypto multiple compression. This chain shaped Q2 asset performance and defines the Q3 watch list.
Evidence Snapshot
- Policy rate: the Fed kept the federal funds rate at 3.50%–3.75%, but the year-end median rate expectation rose from 3.4% to 3.8%.
- Inflation expectations: 2026 headline inflation was revised up to 3.6%, core inflation to 3.3%, versus 2.7% for both in March.
- Yield curve: the 10-year Treasury yield traded around 4.46%–4.55%, while the 2-year rose to 4.17%–4.19%; the 10Y-2Y spread narrowed to roughly 27 bps.
- Dollar and liquidity: DXY broke above 100 in June and moved above 101; the Fed balance sheet was roughly $6.7 trillion, RRP was largely depleted, and TGA became the key marginal liquidity variable.
1. The Fed moved from easing expectations to hawkish patience
The Fed held rates steady in Q2, but the policy message changed materially. At the start of the quarter, markets still priced a possible easing path and expected Chair Kevin Warsh to be more dovish. By the June FOMC, markets had repriced toward a longer period of high rates.
The core change was not the rate level itself but the reaction function. The dot plot moved higher, inflation expectations were revised up, and policy language became less accommodative. Markets began to price the possibility of a rate hike as early as the fourth quarter. For Q3, risk-asset valuation will depend less on any single meeting and more on whether inflation can fall enough to change the Fed’s reaction function.
2. Oil shocks changed the policy path, not the safe-haven narrative
The Iran war is often misread as a test of BTC’s geopolitical hedge status. The real transmission was through energy prices and inflation expectations. Higher oil prices raised inflation risks, limited Fed easing capacity, strengthened the dollar and real yields, and pressured BTC through the policy channel.
Gold outperformed in the initial shock, confirming that traditional safe-haven capital still prefers gold and the dollar. BTC behaved more like a liquid risk asset. It can attract some safe-haven demand in extreme conditions, but its trend price remains governed by global liquidity.
3. Dollar strength compressed crypto risk budgets
DXY broke above 100 and became a major headwind for risk assets. Dollar strength signals tighter global dollar liquidity and affects crypto through three channels: it raises the cost for non-dollar capital to enter crypto, increases the relative appeal of cash and money-market funds, and lowers tolerance for high-volatility assets.
In that environment, capital preserved exposure to highly liquid core assets such as BTC and reduced exposure to ETH, DeFi, and long-tail altcoins. Q2’s market-structure divergence was a direct result of risk budgets being reallocated under a strong-dollar regime.
4. QT is no longer the main variable; TGA is the Q3 variable
The Fed balance sheet was broadly stable in Q2 and the RRP buffer was nearly depleted. Traditional QT is no longer the primary marginal liquidity drain. The Treasury General Account is now a more important variable.
Q3 analysis should therefore shift from “Is the Fed shrinking the balance sheet?” to “How will Treasury finance itself?” If issuance rebuilds the TGA, bank reserves may be squeezed and risk assets may face liquidity pressure. If fiscal spending releases liquidity, BTC and high-beta assets could get a tactical repair window.
5. The market is rewarding certainty again
Q2’s asset divergence was not evidence that crypto became weaker. It was evidence that markets started rewarding certainty again. BTC outperformed ETH and most altcoins because it has the deepest liquidity, the clearest allocation language, and the most mature institutional access. RWA grew because it has real yield, compliance pathways, and institutional demand. Long-tail altcoins struggled because they rely on new liquidity, narrative diffusion, and higher risk appetite.
The market is no longer willing to prepay for long-dated narratives without near-term evidence. It now demands shorter cash-flow paths, clearer value capture, and stronger liquidity support.
Correlation Regime Shift
Pair
Before Shift
Q2 High
Direction
BTC – Nasdaq
-0.68
+0.72
Negative to positive
BTC – S&P 500
+0.13
+0.74
Sharp increase
BTC – Gold
-0.49
+0.16
Negative to mildly positive
BTC 20-week rolling
-0.50
+0.13
Negative to positive
· Market Implication
The central Q3 question is not whether the market can bounce. It is what drives the bounce. If the move is driven by short covering and sentiment repair, it is likely tactical. If it is supported by renewed ETF inflows, a weaker dollar, TGA liquidity release, and regulatory progress, it can become a trend repair.
HTX Research reduces the Q3 macro framework to three variables: Fed: whether policy remains hawkish; Treasury: whether financing drains liquidity; CLARITY: whether regulation reopens institutional risk budgets.
HTX Research View
The Q2 decline should not be read as the failure of crypto’s long-term logic. It was a stress test. It showed which assets retain allocation value under liquidity contraction, which assets rely on narrative and leverage, and which sectors have real demand across cycles. BTC is the liquidity proxy. ETH is the value-capture question. DeFi is about cash flow and risk management. RWA is capital migration. Regulation is institutional access. Q3 depends not on a new narrative, but on whether liquidity and regulation improve at the margin.
Chapter 2: Bitcoin: The Liquidity Proxy
Why BTC Is No Longer Just a Crypto Asset
Thesis
BTC is no longer only a crypto-native asset. It has become a proxy for global dollar liquidity.
Q2 validated this framework. BTC hit a local high in mid-May, then fell rapidly, broke key support levels in June, and entered a low-range consolidation. On the surface, the move was driven by ETF outflows, weaker corporate treasury demand, and derivatives liquidation. At a deeper level, it was a concentrated repricing of BTC under tighter global liquidity.
BTC’s pricing framework is changing. In the past, markets understood BTC through halving cycles, on-chain holding behavior, and crypto-native liquidity. Today, ETFs, macro funds, corporate treasuries, and institutional accounts have inserted BTC into global portfolios. Its price is increasingly determined by the dollar, real yields, risk budgets, and global net liquidity.
BTC Q2 Fact Sheet
Variable
Q2 Reading / Event
Market Meaning
Price
Approx. $82,000 high to approx. $59,000 low
About 24% peak-to-trough compression; valuation repricing confirmed
ETF monthly flows
April +$1.97B; May -$2.43B; June -$2.45B
Marginal buyer turned into selling pressure
ETF cumulative net inflows
Approx. $58.09B peak to approx. $53.22B
Long-term channel intact, but quarterly marginal flow weakened
ETF total net assets
Approx. $100.5B to approx. $77.5B
AUM compressed by both price declines and redemptions
Corporate treasury
Strategy sold 32 BTC in late May; holdings approx. 847k BTC; cost basis around $75,651
Small in size, large in signaling value
Derivatives
Aggregate OI approx. 290k BTC high to approx. 257k; largest liquidation event in early June
Deleveraging amplified the pace of decline
1. ETF flows determine the marginal price
Spot BTC ETF flows were the most important marginal variable in Q2. In April, ETFs still delivered net inflows and supported the move higher. After mid-May, flows reversed sharply. Weekly flows turned negative almost exactly as BTC reached its local top, and June continued the outflow trend.
Over the long run, BTC ETFs remain the core institutional allocation channel. The accumulated base has not disappeared and productization remains intact. But at the quarterly horizon, marginal price-setting shifted from new inflows to existing-position rebalancing. BTC did not top because of a single shock. It lost support when the marginal buyer disappeared.
2. Corporate treasury demand entered a constraint phase
Corporate treasuries were once among the strongest demand narratives for BTC. In Q2, that logic became more constrained. Strategy-style treasury accumulation depends on capital-market windows, equity premiums, and preferred-share financing capacity. When BTC falls, financing instruments trade at a discount and the cost of capital rises, purchase capacity naturally weakens.
The small sale by Strategy was not important because of size. It mattered because of signal. Corporate treasury demand is not a one-way, unlimited, stable source of buying. It is reflexive: rising BTC can improve financing capacity, which supports further buying; falling BTC can reduce financing capacity, which weakens marginal demand. Q2 began to price this reflexivity.
3. Leverage unwinding amplified the speed of decline
ETF outflows and weaker treasury demand explain direction; derivatives explain speed. Aggregate perpetual OI rose to a quarterly high near the top. When price broke support, forced long liquidations triggered cascading selling, pushing BTC lower in a short period.
Such moves are often driven less by new fundamental information than by the leverage accumulated before the break. Q2’s liquidation cascade shows that while BTC has become more institutional, derivatives positioning still amplifies volatility at turning points.
4. BTC’s safe-haven narrative needs to be redefined
Q2 again tested BTC’s safe-haven narrative. In the early phase of the war shock, gold clearly outperformed BTC, the dollar strengthened, and BTC traded with risk assets. Traditional capital still chooses gold and dollars first during immediate geopolitical shocks.
That does not mean BTC has no hedge value. It means BTC’s hedge value is structural rather than immediate. It is less a short-term war hedge than a longer-term hedge against monetary regimes, capital controls, and fiat debasement. At the quarterly trading horizon, liquidity still holds the pricing power.
Market Implication
Q3 BTC analysis should not rely only on on-chain indicators or geopolitical headlines. Four variables matter most: whether ETF flows turn sustainably positive again; whether DXY peaks and weakens; whether TGA rebuilding drains liquidity; and whether corporate treasury financing windows reopen. If these improve together, BTC can regain trend-repair conditions. If sentiment improves without flows and liquidity support, BTC is more likely to remain range-bound.
HTX Research View
HTX Research maintains an Overweight view on BTC for Q3, not because of a point-price forecast but because of asset-attribute change. BTC is the only crypto asset that simultaneously offers institutional access, macro expression, deep liquidity, and long-term scarcity. It will not rise independently of global liquidity, but when liquidity improves, it remains the most likely first recipient of institutional reallocation. For Q3, BTC’s direction depends on liquidity, its upside beta depends on ETF flows, and its key risk is the dollar.
Chapter 3: Ethereum: The Value Capture Challenge
Can Ethereum Translate Growth into Value?
Thesis
Ethereum’s problem is not whether the ecosystem is growing. It is whether that growth can translate into ETH value.
ETH underperformed BTC in Q2 and ETH/BTC continued to weaken. The surface explanation is that ETH is a higher-beta asset in a risk-off environment. The deeper explanation is that markets are reassessing ETH’s value-capture model.
Ethereum activity remains significant. Layer2 transactions are growing, stablecoins and DeFi still rely heavily on the Ethereum ecosystem, and developers and applications have not disappeared. But the market is asking a different question: can this activity flow back into L1 fees, base-fee burn, staking yield, ETF flows, and ETH-holder value?
ETH / BTC Evidence
- During Q2, BTC fell about 6.1%, while ETH fell about 19.1%; ETH/BTC declined from roughly 0.0314 to 0.0271, a drop of about 13.9%.
- U.S. spot BTC ETFs had cumulative net inflows of roughly $53.45 billion, versus roughly $11.21 billion for ETH ETFs, leaving a large institutional capital-base gap.
- As of mid-June, BTC ETFs had Q2 net outflows of about $2.65 billion and ETH ETFs about $384 million. The ETH issue is less the single-quarter outflow and more the lack of long-term institutional depth.
- After Dencun, L2 data costs fell, but L1 fee and burn capture declined. On Ultrasound.money-style readings, annualized burn was roughly 21k ETH versus annualized issuance near 1.03 million ETH, with 30-day annualized supply growth around 0.83%.
- ETH staking rewards were around 1.42% on a 30-day basis, not enough to create a standalone institutional allocation advantage in a high-Treasury-yield environment.
1. BTC has simpler allocation language; ETH has a more complex thesis
BTC’s institutional allocation language is standardized: fixed supply, spot ETF, digital gold, macro hedge, reserve asset. ETH’s thesis is more complex. It is a smart-contract platform, a staking-yield asset, a DeFi and stablecoin settlement layer, and an ecosystem linked to Layer2s, LSTs, LRTs, MEV, and restaking. Complexity is not negative, but it requires more evidence before institutions convert ecosystem growth into asset allocation.
2. Layer2 improved efficiency but weakened L1 revenue
Ethereum’s scaling roadmap has been technically successful. Layer2s reduced transaction costs, improved throughput, and expanded the application surface. But markets do not reward technical progress alone; they reward the economic value that technical progress creates.
After Dencun, lower blob costs improved L2 economics but reduced mainnet fee capture. Usage still exists, but L1 fees, burn, and protocol revenue have not grown with the same intensity as in earlier high-fee cycles. The core valuation tension is clear: Ethereum may be becoming a better settlement layer, but whether ETH therefore becomes a better asset still needs proof.
3. Stablecoin growth no longer equals Ethereum mainnet growth
Stablecoin growth used to mean Ethereum mainnet growth. Q2 further weakened that relationship. Stablecoin supply stayed elevated, but marginal activity moved toward lower-cost networks such as Tron, Solana, and Base. Ethereum remains a critical security and settlement layer, but it no longer monopolizes on-chain dollar activity.
For ETH, the implication is direct: stablecoin growth on other chains, or on Layer2s with lower settlement cost, does not convert into L1 fees and ETH burn the way it once did. Q3 ETH analysis must track mainnet stablecoin balances, whether L2 growth increases settlement demand, and whether L1 fees and burn show sustained improvement.
4. Staking yield is not enough against high rates
ETH staking makes ETH a yield-bearing asset, but the high-rate environment reduces that advantage. When Treasuries and money-market funds offer high risk-free yields, ETH staking yield is not enough compensation for price volatility, regulatory uncertainty, liquidity risk, and technical risk.
Staking alone will not drive an ETH rerating. It must combine with clearer regulation, more mature ETF products, and stronger ecosystem cash flow before becoming a strong institutional allocation reason.
5. ETH needs catalysts, not only oversold conditions
ETH has tactical rebound potential after valuation compression, weak ETH/BTC, and bearish positioning. But a move from oversold rebound to trend repair requires catalysts. The most important catalysts are visible value capture: higher L1 fees, better burn, renewed ETF inflows, larger staking products, stablecoin return to Ethereum, and regulatory clarity around DeFi and staking.
Market Implication
ETH’s Q3 risk-reward is more asymmetric than BTC’s, but confirmation requirements are also higher. If CLARITY advances, ETH ETF flows recover, and DeFi regulatory expectations improve, ETH could outperform BTC because its regulatory and value-capture discounts remain larger. If liquidity tightens and L1 revenue does not improve, ETH/BTC can remain weak.
HTX Research View
HTX Research maintains a Neutral / Tactical Long view on ETH. Ethereum remains one of crypto’s most important settlement and application infrastructures, but ETH must prove that ecosystem growth can convert into ETH value. In Q3, ETH’s direction depends on regulation, its upside beta depends on DeFi, and its confirmation depends on fees and burn.
Chapter 4: Capital Efficiency
Why DeFi Is Being Repriced Around Cash Flow and Risk
Thesis
DeFi is moving from a TVL narrative to a pricing regime based on cash flow, risk management, and capital efficiency.
Q2 blue-chip DeFi showed a paradox: some protocols improved fundamentals while tokens remained weak. Uniswap advanced fee capture, Sky expanded RWA-driven revenue, and Aave strengthened risk governance after a stress event. Token valuations did not fully follow because the market is changing what it considers fundamental.
The previous cycle rewarded TVL, user growth, and protocol scale. The current regime requires real revenue, controllable risk, and token-level value capture. If growth cannot translate into token value, the market will not grant a durable premium.
Blue-chip DeFi Repricing
Protocol
Core Fundamental Change
Q2 Price Action
Type of Divergence
Sky
USDS +67.9%; revenue +56.8%
-23.1%
Extreme divergence
Uniswap
Annualized revenue around $47.75M; effective burn rate around 3.2%
Near $3 low range
Deflation paradox
Aave
TVL down 40%–50% after event impact
-30%
Trust discount
Curve
Technology adopted, but TVL and collateral positions under pressure
-40%
Structural failure
Compound
Coordinated risk control verified; TVL relatively stable
Short-term rebound
Mild divergence
1. TVL is no longer the core DeFi valuation metric
TVL once served as the key growth metric because it represented liquidity, trust, and usage. In a high-rate, low-risk-appetite environment with recurring security events, its explanatory power is weakening. TVL can be incentive-driven or subsidy-driven. It shows that capital has entered the protocol, but not whether the protocol earns money or whether token holders benefit.
The market now asks whether revenue is real, whether it is sustainable, whether it accrues to tokens, whether risk events can wipe out years of earnings, and whether the protocol has institutional-grade risk controls. DeFi valuation is moving closer to traditional finance: assets under management matter less than spreads, revenue quality, risk costs, and governance.
2. Blue-chip DeFi is becoming differentiated
Blue-chip DeFi is no longer one homogeneous beta bucket. Uniswap is moving toward fee capture and token burn. Aave’s value lies increasingly in risk governance and extreme-event response. Sky is becoming closer to an on-chain balance sheet with RWA assets and USDS/sUSDS liabilities. Curve and Compound face different structural trade-offs between technology influence, governance, and growth. The unified DeFi beta is fading.
3. Security events increased the DeFi trust discount
Q2 security events forced the market to reprice systemic DeFi risk. DeFi’s advantage is composability; composability is also a risk-transmission channel. A bridge, oracle, LST, or external collateral issue can spread through lending markets, collateral systems, and liquidity pools.
Risk Event Reference
- On April 18, a Kelp DAO-related security event involved a cross-chain bridge configuration vulnerability and roughly $292 million of forged rsETH.
- Aave TVL fell from roughly $26.4 billion to $18.6 billion in 48 hours; total DeFi TVL lost roughly $13.2 billion in two days and touched a one-year low around $82.4 billion.
- After the event, the market applied a broader risk discount to bridges, oracles, LST/LRT collateral, and external dependencies.
4. Compliance rails change DeFi capital transmission
Institutional capital increasingly enters crypto through compliant and isolated channels: permissioned pools, OTC, custody accounts, whitelisted RWA products, and regulated stablecoins. These flows may increase underlying activity without directly entering public DeFi order books or buying governance tokens.
This creates a new tension: asset scale may grow, protocol use cases may expand, but token prices do not necessarily rise. Protocols must design clearer value-capture paths, or they may face “hot assets, cold tokens.”
5. Cash-flow assets will command higher premiums
If regulation advances in Q3, DeFi can recover, but not through a broad beta rally. The market will likely reward three types of protocols: those with real revenue and fee-return mechanisms, those with strong risk isolation and governance, and those deeply integrated with RWA, stablecoins, and compliant institutional capital.
Market Implication
DeFi’s Q3 upside depends on regulation and liquidity. If CLARITY advances, the regulatory discount on DeFi can contract quickly. But if liquidity remains tight, capital will select a narrow group of leading protocols rather than the full sector. DeFi recovery will be structural, not broad-based.
HTX Research View
HTX Research maintains a Selective Overweight view on Quality DeFi. Selection should not be based on TVL ranking, but on real revenue, risk control, and value capture. The market will reward protocols that can earn money, manage risk, and return value to token holders.
Chapter 5: Where Capital Is Going
RWA, Stablecoins, Tokenized Equities, and the New Capital Rail
Thesis
Q2 price weakness did not stop capital migration. RWA, stablecoins, and tokenized securities are moving crypto from a trading market toward financial infrastructure.
If one looks only at BTC and altcoin prices, Q2 was a risk-asset drawdown quarter. If one looks at infrastructure, Q2 was a quarter of continued expansion in on-chain finance. RWA grew, stablecoin supply remained high, tokenized equities entered a competitive exchange phase, and AI-agent payments began to form a new demand narrative.
1. RWA is the most natural on-chain demand in a high-rate environment
RWA continued to expand because high rates create a natural demand for yield on-chain. Stablecoins sitting idle are non-yielding cash. Tokenized Treasuries, money-market funds, and short-duration yield products provide a near-traditional-finance yield while preserving on-chain transferability, composability, and settlement advantages.
RWA matters because it solves crypto’s long-standing shortage of high-quality asset-side collateral. DeFi historically revolved around native-token leverage loops, where asset-side volatility was high and yield sources were unstable. RWA introduces Treasuries, credit, and cash-management instruments, making on-chain finance closer to a real balance-sheet system.
RWA Market Snapshot
- Tokenized RWA excluding stablecoins increased from roughly $29.49 billion to $32.28 billion, up about 9.5%.
- Tokenized Treasuries rose from roughly $13.65 billion to $15.04 billion, remaining the main source of incremental growth.
- Circle USYC reached roughly $3.07 billion, exceeding BlackRock BUIDL at around $2.37 billion; Ondo USDY reached around $2.15 billion, with 90-day growth of roughly 63%.
- Internal sector rotation was visible: tokenized stocks grew about 54.9% to $1.58 billion, corporate credit rose about 25% to $1.75 billion, while commodities and asset-backed credit fell roughly 12.5% and 15.3%.
2. RWA competition is shifting from brand to composability
Early RWA competition relied heavily on issuer credibility and traditional-finance branding. Q2 showed that integration depth matters more. Whether an RWA product can be used as lending collateral, enter margin systems, combine with stablecoins and DeFi, and support institutional custody and compliance will determine its long-term scale.
The moat is no longer only yield. It is distribution and composability. A passive tokenized Treasury resembles an on-chain money-market wrapper. A product that becomes part of lending, margin, settlement, and payment infrastructure becomes a true on-chain financial rail.
3. Stablecoins are becoming payment networks, not just trading tools
Stablecoins remain crypto’s most important infrastructure. Q2 supply growth slowed, but use cases expanded. Stablecoins are moving beyond exchange funding, on-chain trading, and DeFi collateral into cross-border payments, merchant settlement, institutional clearing, and global dollar distribution.
Their long-term opportunity is not inside crypto alone. It is global dollar digitization. For many non-U.S. users and institutions, stablecoins offer a more efficient way to access dollar liquidity, reduce cross-border settlement costs, and bypass traditional banking time-zone constraints.
Stablecoin Supply Map
Stablecoin
Start
End
Change
Major On-chain Change
USDT
$184.3B
$186.4B
+1.2%
Tron +3.4B; ETH -0.8B
USDC
$77.2B
$74.9B
-3.0%
ETH -2.8B; Hyperliquid +1.3B
USDe
$5.9B
$4.1B
-30.3%
ETH -2.2B; Solana +0.6B
PYUSD
$3.9B
$2.8B
-29.9%
ETH -1.1B
USDS
$9.0B
$8.2B
-8.6%
ETH -0.8B
BUIDL
$2.8B
$3.0B
+9.0%
Avalanche +0.3B; Aptos +0.3B
4. Tokenized securities are in early positioning
Q2 saw tokenized equities and on-chain securities enter a more competitive phase among trading platforms. The key issue is not short-term volume, but the redrawing of market boundaries. U.S. domestic regulatory progress remains slow, while offshore compliant structures and international user demand provide a more realistic starting point.
Tokenized equities are not about replacing Nasdaq or NYSE immediately. They are about giving non-U.S. users, crypto-native capital, and 24/7 global trading demand a new access channel to traditional assets. The key Q3 indicators are real liquidity, compliant custody, corporate actions handling, market-maker support, and cross-platform settlement.
5. AI may create new on-chain payment demand
AI continued to attract capital in Q2 not only because it is a new narrative, but because it may create new payment demand. AI agents need automated payments, micro-payments, settlement, identity, permissions, and data markets. Traditional banking rails are not well designed for high-frequency, small-value, cross-border, machine-to-machine transactions. Stablecoins and on-chain settlement are naturally suited to this use case.
6. Infrastructure expansion matters more than price
Q2 price action was weak, but infrastructure did not stop expanding. RWA solves yield assets. Stablecoins solve dollar settlement. Tokenized securities solve access to traditional assets. AI payments solve new automated demand. Layer2s and wallets improve user experience. Custody, KYC, and permissioned pools lower the institutional entry barrier. These changes do not appear in token prices every day, but they determine whether crypto can evolve from a speculative market into financial infrastructure.
Market Implication
Q3 opportunities are not only about price repair, but capital migration. If global liquidity improves, BTC and high-beta assets will rebound first. If regulatory clarity improves, RWA, stablecoins, DeFi, and tokenized securities can receive more durable institutional flows. If both occur at the same time, the market can move from defensive repair to structural expansion.
HTX Research View
HTX Research remains Overweight RWA, structurally positive on stablecoin infrastructure, in watch mode on tokenized equities, and selectively positive on AI x crypto. Price determines sentiment; infrastructure determines the cycle.
Chapter 6: Regulation as a Catalyst
Why Regulatory Clarity Is Becoming a Market Variable
Thesis
Regulatory clarity is shifting from a source of risk discount to a valuation catalyst.
The Q2 regulatory story is not about any single clause. It is about a shift in the U.S. digital-asset regulatory model: from enforcement-led to legislation-led, from ex-post punishment to ex-ante frameworks, and from regulatory uncertainty to institutional competition.
The CLARITY Act gave markets the clearest signal in years that a U.S. digital-asset framework may be entering a real landing window. Even if final passage still depends on politics, markets have begun to reprice the effect of regulatory clarity on crypto assets.
1. The CLARITY Act matters beyond the bill itself
Q2’s procedural progress marked the closest U.S. digital-asset legislation has come to implementation in recent years. The important point is not a specific amendment, but the attempt to establish unified regulatory boundaries for digital assets. The biggest institutional problem has not been strict regulation, but unclear regulation. Blurred boundaries across the SEC, CFTC, banking regulators, and state regulators make it difficult for institutions to determine which assets can be held, which businesses can operate, and which risks can be approved by compliance teams.
CLARITY Act Timeline and Vote Math
Milestone
Fact
Market Meaning
Mid-May
Senate Banking Committee passed markup 15-9
Procedural breakthrough; bipartisan support remains fragile
June 1
Placed on Senate legislative calendar, Calendar No. 423
Can proceed to floor vote without further committee action
Mid-June
House signaled fast-track coordination if Senate passes
Lower two-chamber procedural friction
Vote threshold
Needs 60 votes; Republicans approx. 53 seats; roughly 7 Democratic votes needed
Q3 variable shifts from text to vote math
Ethics clause
Van Hollen amendment failed
Political negotiation remains the main uncertainty
2. Stablecoin rules define the boundary of on-chain dollars
Stablecoins are central to the current regulatory debate. The key issues are whether stablecoins can pay yield, how issuers manage reserves, how payment use cases are regulated, and how DeFi protocols fit into the framework. Q2’s compromise suggests U.S. regulators are not seeking to ban stablecoins, but to bring them into banking, payments, and AML frameworks.
This is structurally positive. The more compliant stablecoins become, the easier it is for them to enter corporate payments, cross-border settlement, institutional clearing, and traditional payment networks. But regulation will also change competition: issuers with transparent reserves, strong compliance, banking relationships, and broad payment distribution will gain advantage.
3. Ethics clauses and vote math remain the key uncertainty
The technical obstacles have declined, but the political obstacles remain. Senate passage still requires bipartisan support, and debates around conflicts of interest for government officials remain unresolved. For Q3, the market will trade not only whether the bill passes, but the probability path toward passage. Crypto assets will price probability changes before final text is enacted.
Market Reaction Reference
- After the committee advance in mid-May, BTC briefly reached roughly $81,965 and crypto-related equities rallied.
- Coinbase rose about 9.10% in one day, MicroStrategy about 8.16%, and Robinhood about 6.16%.
- In derivatives markets, regulatory-sensitive token shorts saw more than $250 million of liquidations within several hours.
4. Regulatory upside will not be evenly distributed
Regulatory clarity will not benefit all assets equally. BTC already has the most mature spot ETFs, the clearest asset narrative, and the strongest institutional access. The larger marginal beneficiaries are likely ETH, DeFi, stablecoins, RWA, and tokenized securities, where regulatory discounts are still more meaningful.
This is why HTX Research treats regulation as the second core Q3 variable after liquidity. Liquidity sets the market direction; regulation determines where the capital goes.
5. Global regulatory competition is accelerating
The U.S. is not the only variable. MiCA is already being implemented in Europe, while Hong Kong and Singapore continue to refine digital-asset frameworks. Major financial centers are competing for digital-asset companies, stablecoin issuers, RWA products, and institutional trading flows. If the U.S. moves slowly, innovation and capital may migrate to clearer jurisdictions. If the U.S. builds a framework, it can again become a global center for digital-asset rules.
Market Implication
Q3 regulatory trading is probability repricing. If CLARITY advances, ETH, DeFi, stablecoins, and RWA should show stronger repair beta. If the bill stalls, regulatory discounts return and the market will likely favor BTC and cash-flow certainty. Regulatory clarity will not create a bull market by itself, but it can unlock institutional risk budgets and change valuation ranges for assets with product, custody, and compliance pathways.
HTX Research View
HTX Research views regulatory clarity as the most important non-macro variable in Q3. Regulatory progress supports BTC, catalyzes ETH, rerates DeFi, and accelerates RWA. If liquidity determines market direction, regulation determines where capital flows.
Chapter 7: Q3 Strategy
Liquidity, Regulation, and the Path Forward
Thesis
The Q3 crypto market will be determined by two forces: whether global liquidity improves at the margin, and whether regulatory clarity releases institutional risk budgets.
Q2 completed the stress test. The market now knows which assets depend on liquidity, which sectors have real demand, and which narratives lack value capture. Q3 is not about finding a new narrative. It is about identifying the conditions that move markets from valuation compression to structural repair.
HTX Research frames Q3 in three scenarios: Base Case, Bull Case, and Bear Case.
Q3 Validation Framework
Macro Variable
Valid Bullish Signal
Transmission to BTC
10Y TIPS real yield
Falls from above 2.2% without growth deterioration
Lowers opportunity cost for non-cash-flow assets
DXY
Stops rising or weakens with real yields
Improves global dollar liquidity and non-U.S. bid
TGA / reserves
Treasury flow no longer drains liquidity; reserves stable
Reduces liquidity-contraction concerns
FOMC / SEP
Communication shifts from inflation defense toward growth/financial-condition balance
Helps BTC move from defensive holding to trend trade
On-chain supply
Exchange balances do not rise quickly; LTH supply remains high
Keeps floating supply tight and magnifies buying impact
Base Case – Probability 60%
Macro Setup
In the base case, the Fed keeps rates unchanged but remains hawkish. Inflation falls slowly, energy prices remain a swing factor, and markets do not quickly return to a rate-cut trade. The dollar stays range-bound at elevated levels. Global risk assets recover tactically, but broad expansion conditions are not yet in place.
TGA rebuilding and Treasury issuance still create periods of liquidity drain. CLARITY continues to advance, but final passage still requires bipartisan negotiation. Markets price rising probability but not full implementation.
Market Structure
- BTC remains in a repair range and outperforms most altcoins.
- ETH can rebound tactically but needs confirmation from fees, burn, and ETF inflows.
- Leading DeFi protocols outperform long-tail protocols.
- RWA and stablecoins continue to expand steadily.
- Long-tail altcoins lack the conditions for a broad rally.
Allocation
Asset / Sector
Allocation View
Rationale
BTC
Overweight
Liquidity proxy with defensive quality and institutional access
ETH
Neutral / Tactical Long
Valuation compressed, but confirmation still needed
Quality DeFi
Selective Overweight
Benefits from regulatory probability repricing and cash-flow valuation
RWA
Overweight
Supported by real yield and institutional demand
Stablecoin Infrastructure
Positive
Long-term beneficiary of payment and settlement infrastructure
AI
Selective Positive
Clear new-demand direction, but valuation dispersion is high
Long-tail Altcoins
Underweight
Insufficient new dollars and ongoing supply pressure
HTX Research View
In the base case, Q3 is not a broad bull market. It is a structural repair phase. Asset performance shifts from “what fell the most” to “what has flows, cash flow, and regulatory catalysts.”
Bull Case – Probability 25%
Macro Setup
In the bull case, energy prices fall, inflation expectations improve, the Fed’s hawkish pressure declines, the dollar weakens, real yields fall, and global risk budgets expand. TGA drain is milder than expected and reserve pressure eases. CLARITY moves quickly through key steps, and stablecoin and market-structure legislation sends a strong institutional signal.
Market Structure
- BTC repairs first and attracts renewed ETF inflows.
- ETH outperforms BTC as ETH/BTC stabilizes and rebounds.
- Leading DeFi protocols rerate.
- RWA and stablecoin-linked assets receive institutional premiums.
- Altcoin beta broadens, but quality still matters.
Allocation
Asset / Sector
Allocation View
Rationale
BTC
Overweight
ETF inflows recover and trend is reconfirmed
ETH
Overweight
Regulatory discount contracts; DeFi and staking catalysts improve
Quality DeFi
Overweight
Cash-flow protocols rerate and leading beta strengthens
RWA
Overweight
Compliant assets continue to absorb institutional capital
AI
Positive
Risk-appetite recovery supports growth narratives
Long-tail Altcoins
Market Weight
Beta broadens, but selection discipline remains necessary
HTX Research View
In the bull case, the likely order is BTC first, ETH second, DeFi third, and selective altcoin rotation later. A true broad risk-on regime requires stablecoin expansion and on-chain volume to confirm together.
Bear Case – Probability 15%
Macro Setup
In the bear case, oil prices rise again, inflation expectations worsen, and the Fed reinforces a hawkish stance. The dollar strengthens, short-end rates remain high, and Treasury financing increases liquidity pressure. CLARITY is delayed by political disagreement and regulatory uncertainty returns to stablecoins, DeFi, and tokenized securities.
Market Structure
- BTC is relatively resilient but still pressured by tighter liquidity.
- ETH continues to underperform BTC.
- DeFi regulatory discounts widen again.
- Long-tail altcoins face both liquidity and unlock pressure.
- RWA fundamentals remain relatively stable, but related governance tokens may not benefit equally.
Allocation
Asset / Sector
Allocation View
Rationale
BTC
Market Weight / Defensive Overweight
Most liquid relative asset, but still dollar-sensitive
ETH
Underweight
High beta plus value-capture pressure
DeFi
Underweight except cash-flow leaders
Risk discount widens
RWA
Overweight underlying, selective tokens
Underlying demand stable; token impact varies
Stablecoins / Cash
Overweight
Defense and dry powder
Long-tail Altcoins
Underweight
Most vulnerable to liquidity stress
HTX Research View
In the bear case, Q3 is about preserving liquidity, not hunting for upside. BTC is relatively better than high-beta assets, but real defense comes from cash, stablecoins, and short-duration yield assets.
Altcoin Rotation Test
Q3 Scenario
Trigger Combination
Meaning
Strong diffusion
Stablecoin 30D +$10B or more; ETH/BTC >0.030-0.032; BTC.D falls while total market cap rises; Top 100 breadth >60%
Broad alt beta extends from ETH/large caps to mid-caps and selected long-tail assets
Layered rotation
Stablecoins improve modestly; ETH/BTC stabilizes; TOTAL3/BTC rises selectively; thematic rotation emerges
Focus on high-liquidity, low-unlock, revenue-validated sectors
False diffusion
BTC.D falls but total market cap does not rise; OI/funding jumps; stablecoins keep falling
Reduce long-tail exposure and keep BTC/ETH core positions until second confirmation
Asset Allocation Dashboard
Asset / Sector
Q3 View
Confidence
Primary Driver
Key Risk
BTC
Overweight
High
Global liquidity proxy, ETF access, institutional entry point
Dollar strength and sustained ETF outflows
ETH
Neutral / Tactical Long
Medium
Regulatory catalyst, valuation compression, DeFi repair beta
No fee/burn improvement; ETH/BTC keeps weakening
Quality DeFi
Selective Overweight
Medium-High
Cash flow, risk governance, regulatory discount compression
Security events and weak value capture
RWA
Overweight
High
High-rate yield, institutional compliance demand, on-chain dollar asset side
Rapid rate cuts and product commoditization
Stablecoin Infrastructure
Positive
High
Global dollar settlement, payment networks, regulatory clarity
Bank lobbying tightens rules
Tokenized Equities
Watch
Medium
Traditional assets on-chain, international user demand
Regulatory boundaries and unclear underlying rights
AI x Crypto
Selective Positive
Medium
Agent payments, compute, data markets
High valuations and unproven business models
Long-tail Altcoins
Underweight
High
Insufficient new capital, unlock pressure, low risk appetite
Liquidity improves rapidly and triggers beta rebound
Q3 Risk Matrix
Risk
Probability
Market Impact
HTX Research View
Oil rises again and pushes inflation higher
Medium
Dollar strengthens; risk assets pressured
Watch the second-round energy shock to the Fed reaction function
Fed reinforces hawkish stance
Medium
BTC and ETH valuation pressure
Prioritize high-liquidity assets under high-rate conditions
TGA rebuilding drains more liquidity than expected
Medium
BTC liquidity pressure; altcoins weaker
August Treasury financing is a key watch point
ETF flows remain negative
Medium
BTC rebound capped
Weekly ETF flows are a trend-confirmation indicator
CLARITY Act under-delivers
Medium
ETH, DeFi, and RWA repair delayed
Regulatory probability trade may reverse
Systemic DeFi security event
Low-Medium
Risk discounts widen; TVL leaves
Hold only protocols with strongest risk governance
Stablecoin rules tighten materially
Low-Medium
Payment and RWA narratives pressured short term
Long-term positive for compliant leaders; short-term pressure for high-risk projects
Dollar weakens quickly; liquidity improves faster than expected
Medium
BTC rises first; ETH and DeFi follow
Shift from defense to offense and raise beta exposure
CLARITY passes quickly
Low-Medium
ETH, DeFi, and RWA rerate materially
Regulatory discount compression becomes the main catalyst
Stablecoin Capital Pathways
Path
Trigger
Capital-Flow Feature
Leading Confirmation
A. Bullet enters market
September cut lands; stablecoin net issuance returns; ETF flows recover
Idle capital migrates into crypto buying power
Net issuance + SSR rebound + lending TVL expansion
B. Capital remains loaded
Cuts delayed; macro remains hawkish; stablecoin supply flat
Dry powder rotates between idle and yield-bearing buckets; RWA accumulates
Low SSR + choppy data + range-bound market
C. Bullet leaves market
Cut fails or hike risk returns; stablecoin redemptions persist; ETFs turn negative
Idle capital is redeemed or consumed; weakest combination
Consecutive weekly negatives + TVL decline + higher payment share
Final View
What Matters Most in Q3
Q3 does not need a new narrative. It needs two confirmations: first, whether liquidity has stopped deteriorating; second, whether regulation releases institutional risk budgets.
If only liquidity improves, BTC benefits first. If only regulation advances, ETH, DeFi, and RWA benefit more. If both happen together, the market can move from structural repair to trend expansion. If neither happens, Q3 remains a defensive allocation quarter.
HTX Research’s final Q3 view is: BTC is the core position. RWA is the structural position. Quality DeFi is the upside position. ETH is a tactical position waiting for confirmation. Long-tail altcoins are still not the main theme.
The Q3 market will not reward all risk. It will reward only risk backed by liquidity, cash flow, and a regulatory path.
The post first appeared on HTX Square.