Welcome back to the Chart Decoder Series, where we break down technical charting tools Bitfinex offers.
So far, we’ve covered:
- Moving Averages (SMA & EMA) to spot trends and momentum
- Relative Strength Index (RSI) to identify overbought or oversold zones
- Moving Average Convergence Divergence (MACD) for timing entries and exits with trend shifts
Now let’s dive into Bollinger Bands, a flexible tool that helps traders read volatility and spot extremes in price.
What Are Bollinger Bands?
Bollinger Bands consist of three lines:
- Middle Band: A 20-period simple moving average (SMA)
- Upper Band: The SMA + 2 standard deviations
- Lower Band: The SMA – 2 standard deviations
They stretch and contract based on market volatility.
When the bands are far apart: high volatility
When they’re tight: low volatility (and often a big move is coming)
How to Use It:
**Price exceeds the Upper Band
**This often signals overbought conditions. A short-term pullback or reversal may follow, though strong momentum can drive further gains.**Price dips below the Lower Band
**This may indicate oversold conditions. A bounce is possible, but it’s best confirmed with additional indicators like RSI or volume.**Price moves closely along the Upper Band
**Known as “walking the band,” this usually reflects a strong trend. While it can persist, traders should watch closely for fading momentum.**Bands contract significantly
**A squeeze suggests the market is in a low-volatility phase. These periods often precede sharp breakouts in either direction.**Bands begin to widen
**Indicates rising volatility. The market may be transitioning into a more active phase with larger price swings.
Example in Action:
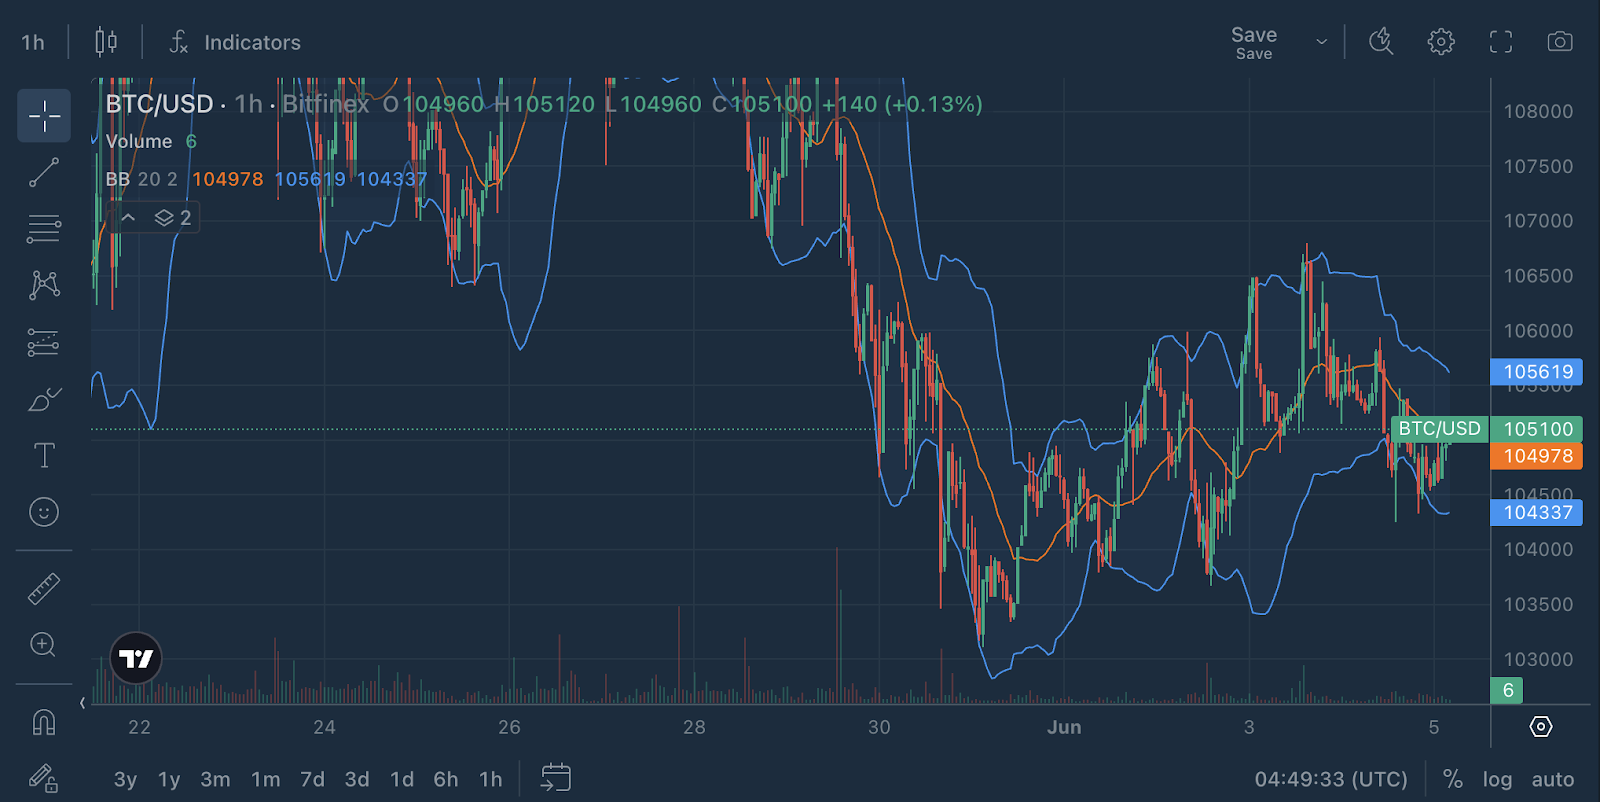
Let’s break down what we’re seeing on a 1-hour BTC/USD chart on Bitfinex, using Bollinger Bands (BB 20, 2) as your main indicator.
- Current price: 105100
- Middle Bollinger Band (20 SMA): 104978
- Upper Band: 105619
- Lower Band: 104337
In this example, BTC is sitting just above the Middle Band, showing tentative signs of strength. This is often a neutral-to-bullish zone, where price is deciding whether it wants to make a move or hang out sideways for a while longer.
What’s interesting is that the Bollinger Bands were wider earlier, reflecting some sharp moves (clearly seen from the recent dips and spikes). But now they’re starting to contract, hinting that the market could be entering a consolidation phase.
What Could Happen Next?
**Bullish Scenario:**If BTC can hold above the Middle Band and we see a few strong candles push higher, a test of the Upper Band (~105619) is likely. A clean break above it could signal an incoming breakout (keep an eye on volume). If the price climbs without strong participation, it may just be a fake-out.
**Bearish Scenario:**If BTC slides back below the Middle Band and volume picks up on red candles, we could revisit the Lower Band (~104337) pretty quickly. This would keep BTC in a short-term downtrend channel.
**Sideways Drift:**The most probable scenario for now: consolidation. The slight tightening of the Bands suggests reduced volatility, meaning BTC might just range between the Middle and Upper/Lower bands while traders wait for a macro catalyst.
Bollinger Bands work best when used with confirming indicators. If you’re serious about catching breakouts or reversals with more confidence, try pairing this with:
- RSI for overbought/oversold confirmation
- Volume for strength validation
- Candlestick patterns near the bands for entry signals
BTC/USD Update with RSI + Bollinger Bands
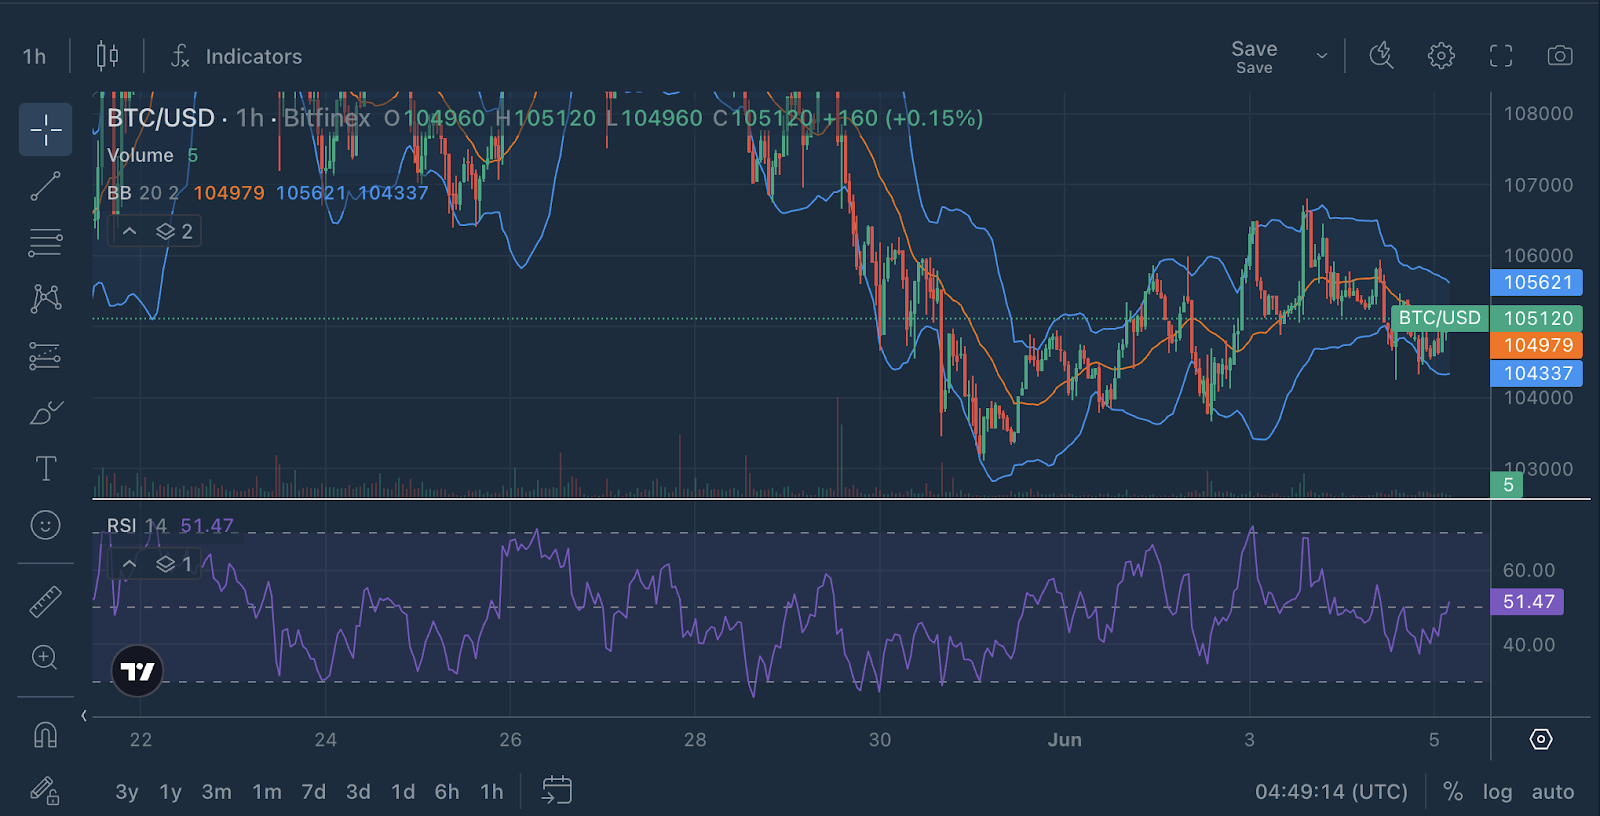
Current RSI (14): 51.47
This puts us right in the neutral zone between overbought (70) and oversold (30). No clear momentum yet, but…
- RSI has been slowly climbing out of a recent low and just broke above 50.
- This can sometimes be seen as a shift in short-term momentum, where bears are losing control and bulls are cautiously stepping in.
Right now, the chart says: neutral-to-hopeful. BTC is crawling back from recent lows, with RSI nudging toward bullish territory. Still a waiting game.
Pro Tips:
- Use Bollinger Bands with RSI or MACD to confirm signals
- Don’t assume every touch of the bands = reversal. Context is key
- Bollinger Band “squeezes” are often followed by powerful moves
- Watch for price – band divergence. This is when the price makes a new high but the band doesn’t widen. This could mean the trend is losing strength and a reversal or slowdown may be near.
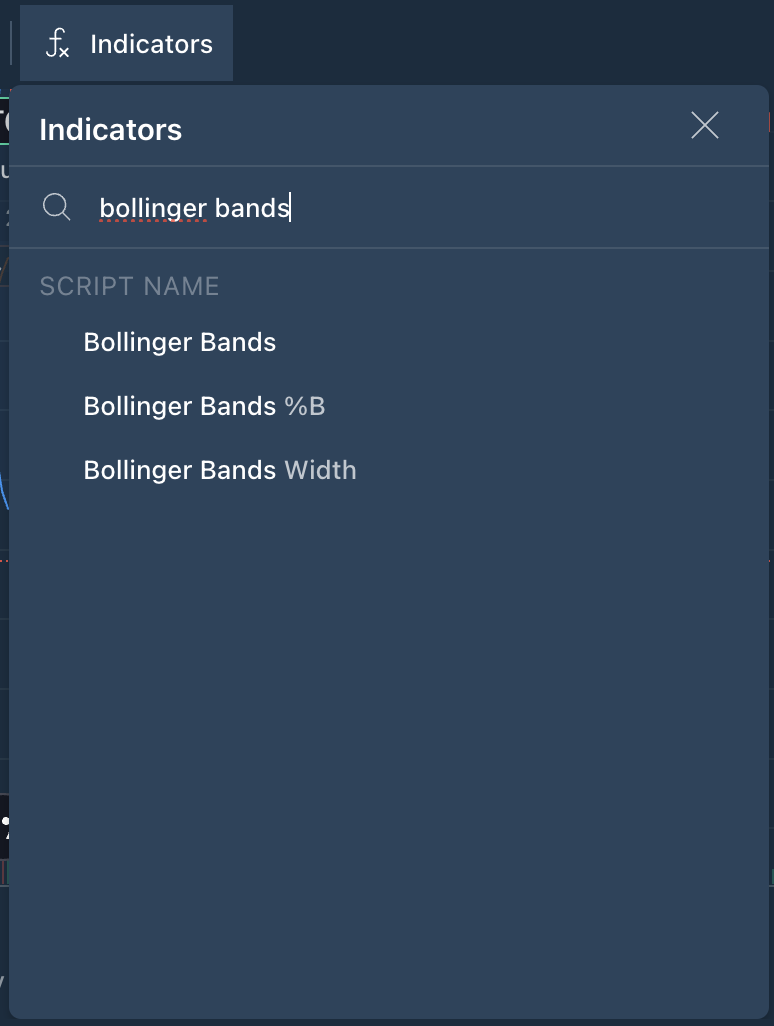
Try Bollinger Bands on Bitfinex:
- Log into Bitfinex
- Open any trading pair chart
- Add Bollinger Bands from the indicators menu
- Look for price breaking the bands, tight squeezes, or strong trends “walking the band”
Next in the Chart Decoder Series: Fibonacci Levels – how to spot natural price targets used by pros and algorithms alike.**
Bitfinex. The Original Bitcoin Exchange.**
The post appeared first on Bitfinex blog.