The market has largely remained in a higher timeframe downtrend despite lower timeframe moves over the past couple of weeks being confined to a narrow range between $65,000–$70,000 before a breakdown. This is the same pattern that has been repeated since October, when we registered the Bitcoin All-Time High (ATH) before the sharp sell off that began on 10/10, with the largest liquidation event in crypto market history..
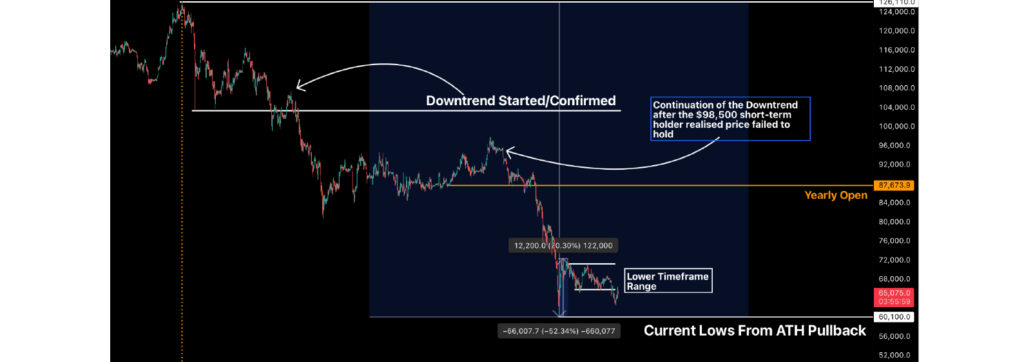 Source: Bitfinex / TradingView. Bitcoin/US Dollar, 4h. October 2025 – February 2026
Bitcoin has fallen as far as 52.3 percent, and has still not confirmed a bottom, despite a 20 percent bounce off the lows since 5 February. Currently, price is still below the $65,000 local range low this week and is retesting lower lows. Given heightened uncertainty in the market following the Supreme Court ruling on the elevated tariff regime introduced by President Trump, precious metals, gold and silver have regained traction, while in crypto markets, traders are paying a premium for downside protection — a trend that had actually reversed just last week for the first time in several months.
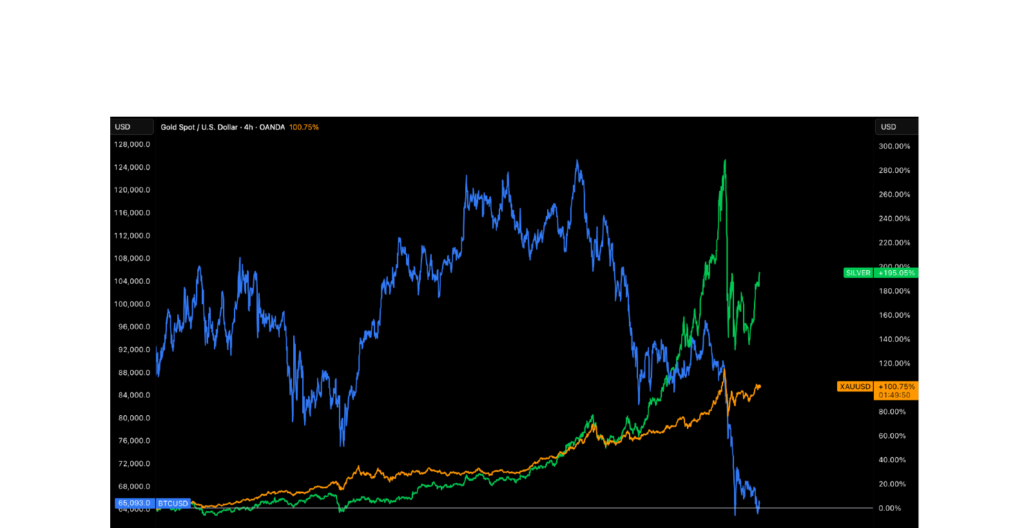 Source: OANDA / TradingView. Gold Spot/USD (XAUUSD) vs Silver vs BTC, 4h, 2025–2026
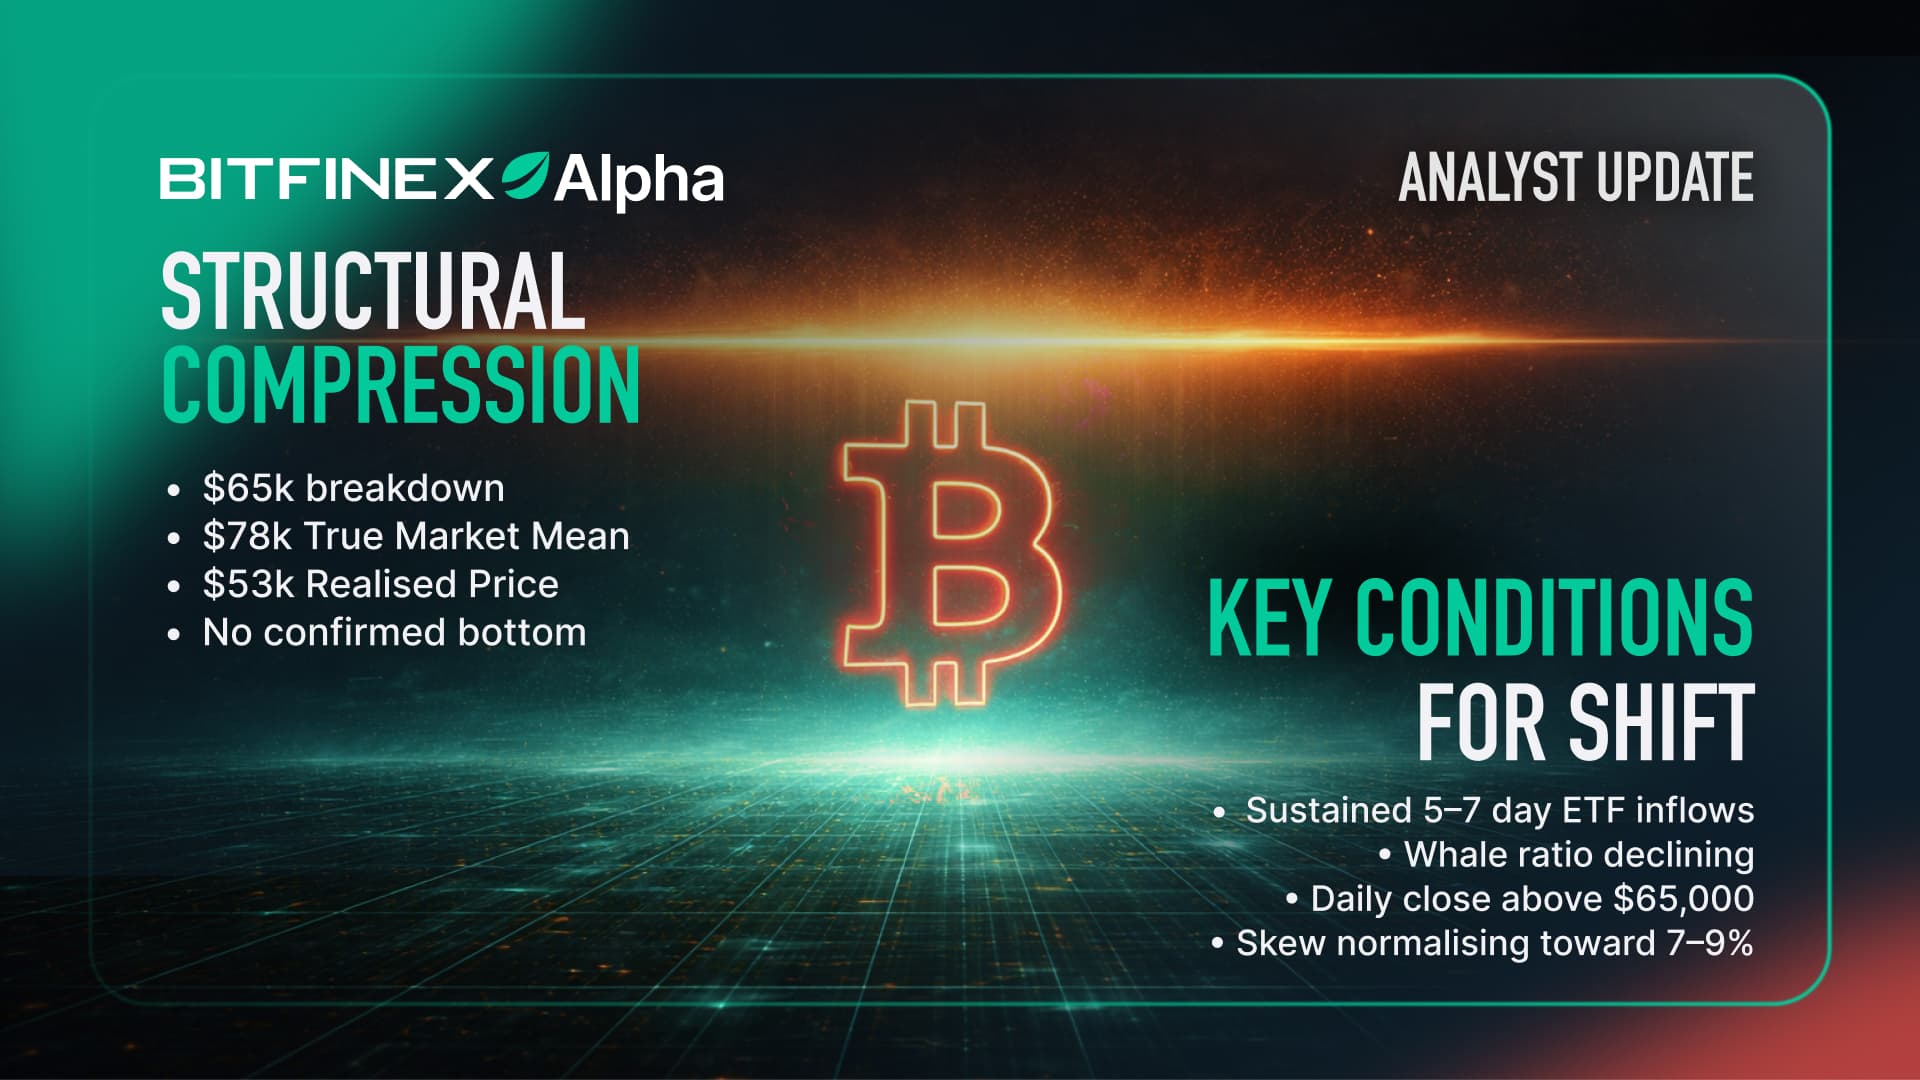
Key Anchors For Price
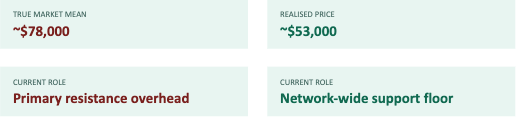
In prior cycles, two valuation anchors have framed extended periods of compression and absorption. In the absence of an immediate macro catalyst, the $78,000 True Market Mean and the $53,000 Realised Price are likely to define the primary resistance and support levels for mid-term market structure.
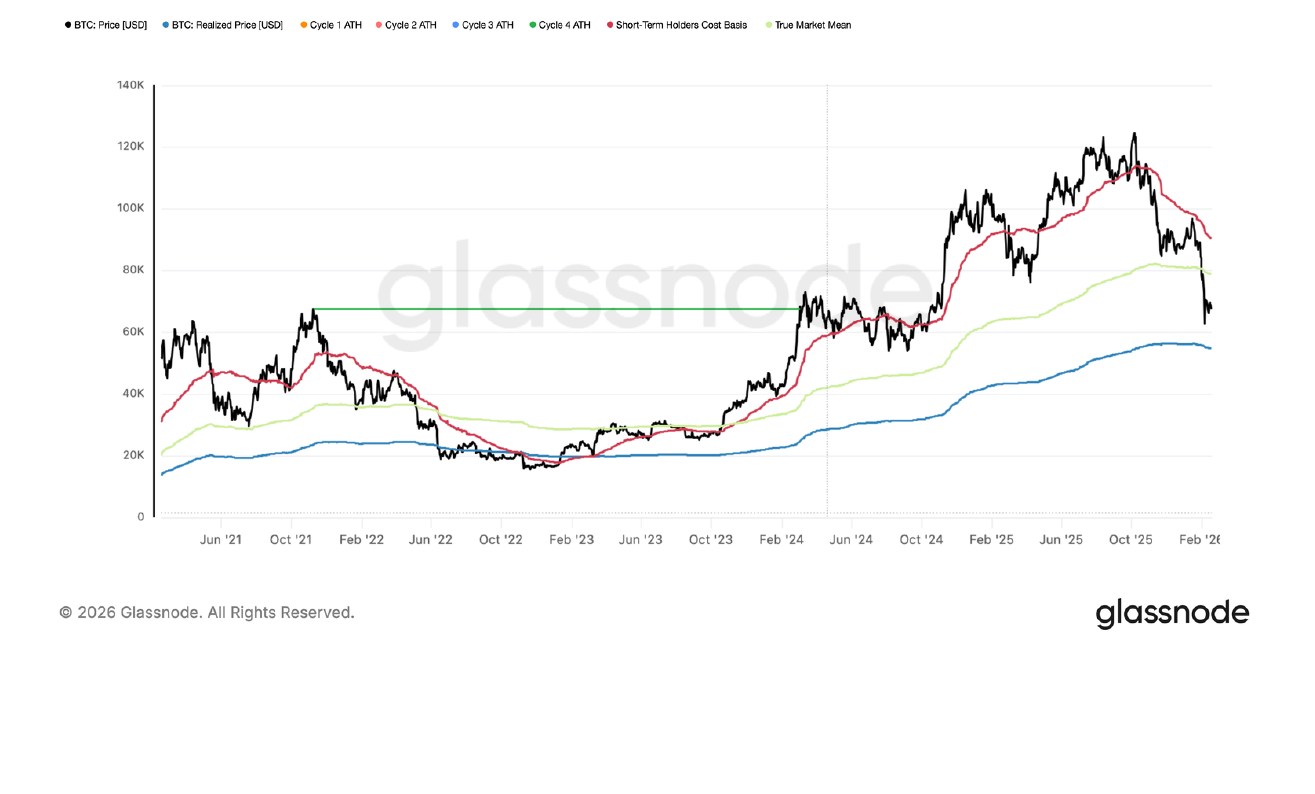 Source: Glassnode. Risk Indicator: Realised Price / True Market Mean / Active Investor Mean / STH Realised Price, 2021–2026
**▌**In prior cycles, the Realised Price has served as the level at which long-term capital meaningfully re-engages. The True Market Mean, now acting as overhead resistance, must be reclaimed on a sustained weekly basis before the structural picture changes.
ETF Flows: A Leading Indicator Of Trend
ETF outflows have significantly impacted price and added to selling pressure that might come from miners and/or long-term holders realising profits. A net $2.6 billion outflow has been recorded across all US-based bitcoin ETF providers year-to-date.
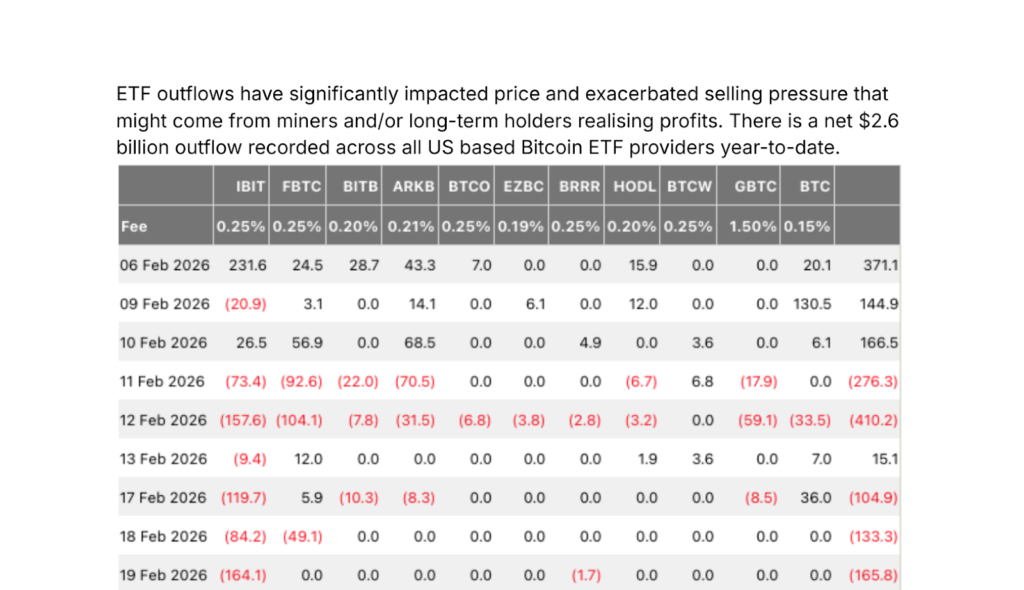 Source: Coinglass. BTC Spot ETF Daily Net Flows by Provider (millions USD), 06 February – 24 February, 2026
ETF Flow Regimes Are A Leading Indicator Of Trend
In the current cycle, the ETF flow regime — defined by multi-day streaks rather than isolated daily prints — has proven to be one of the most reliable forward indicators of trend direction. Sustained inflow or outflow sequences have consistently preceded meaningful price expansions or contractions, often leading derivatives-based metrics such as funding or open interest (OI).
Recent verified prints highlight the regime sensitivity:
→ 23 February: $203.8 million net outflow
→ 24 February: +$257.7 million net inflow
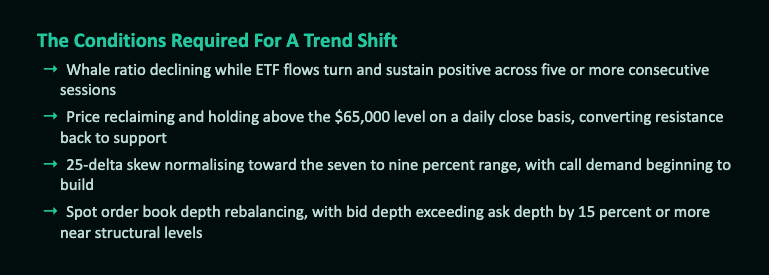
Whilst the sharp inflow on 24 February provides a constructive counter-signal, a single positive session does not constitute a regime shift. What has mattered throughout this cycle is the five-to-seven trading day rolling flow trend. Sustained inflow streaks have historically aligned with structural rallies, whilst clustered outflows have coincided with downside continuation and liquidity withdrawal.
What Traders Should Monitor
→ ETF fatigue: Persistent outflows suggest institutional participants are reducing exposure rather than accumulating dips
→ Institutional de-risking: Broad-based redemptions across issuers indicate asset-class level caution rather than fund rotation
→ Spot-driven pressure: In the absence of ETF absorption, marginal spot demand must step in to stabilise price
Exchange Whale Ratio: Who Is Driving Deposits?
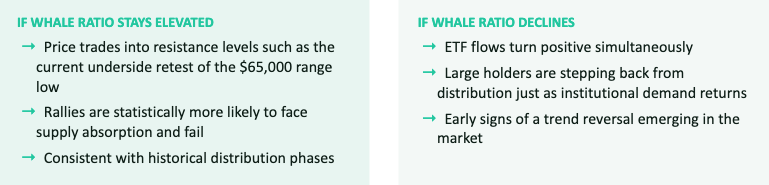
The Exchange Whale Ratio is a critical metric identifying which entities are sending coins to exchanges. When large holders dominate exchange deposits, distribution tends to be more routine, persistent, and structurally bearish — unlike liquidation-driven spikes, which are often short-lived and mechanical.
When exchange inflows are concentrated among large entities, selling pressure becomes strategic. Examples include sellers appearing at key structural levels, or during the same period each day, as has been observed recently. These are not forced liquidations or retail events; rather, they reflect intentional positioning decisions from capital-rich participants.
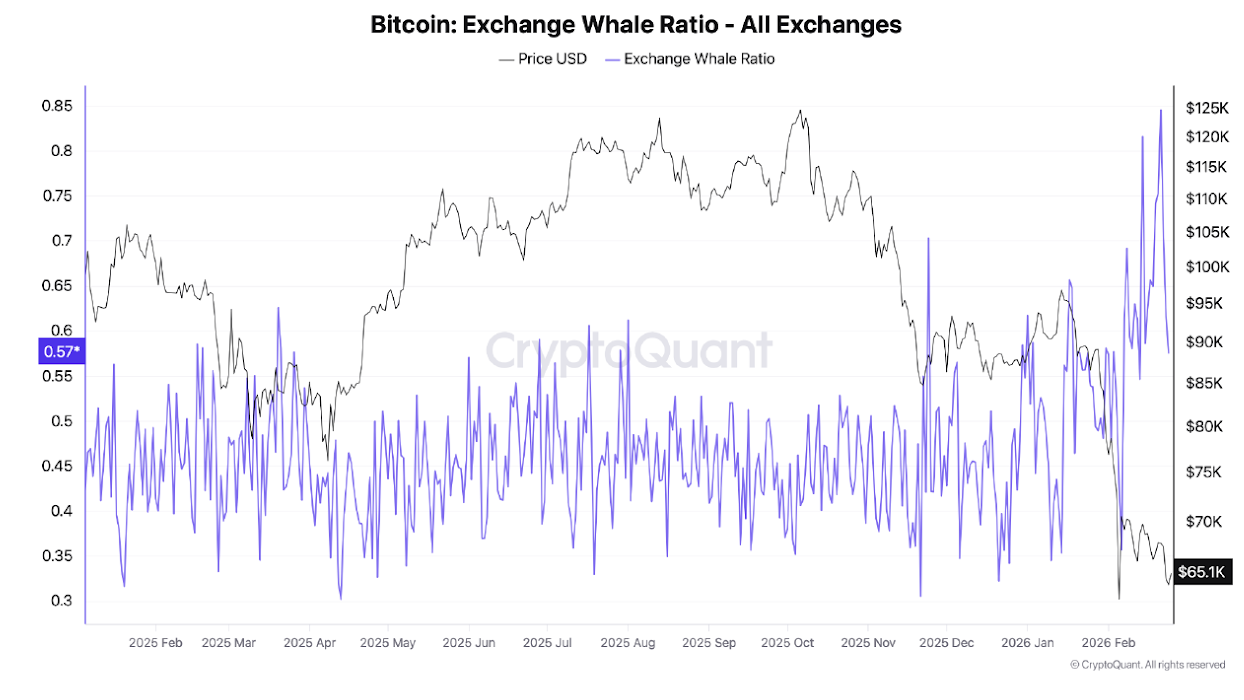 Source: CryptoQuant. Bitcoin Exchange Whale Ratio, All Exchanges. February 2025 – February 2026
→ 64 percent of exchange inflows are coming from the largest cohort of holders
→ This is the highest reading on this metric since October 2015
→ Total exchange inflows peaked at approximately 60,000 BTC on 06 February, a trend that has subsided but not completely reversed.
Options Market: Caution, Not Optimism
Options market participants had removed downside protection for the first time since early December last week, which was evident in the skew and open interest (OI) data. However, following the escalation of tariff news, we have seen a slight shift in positioning. Traders are scaling back extreme tail hedges, but they are not repositioning for upside as they had done earlier. Positioning is currently balanced, but the current summary of short-term expiry trading data suggests caution rather than optimism.
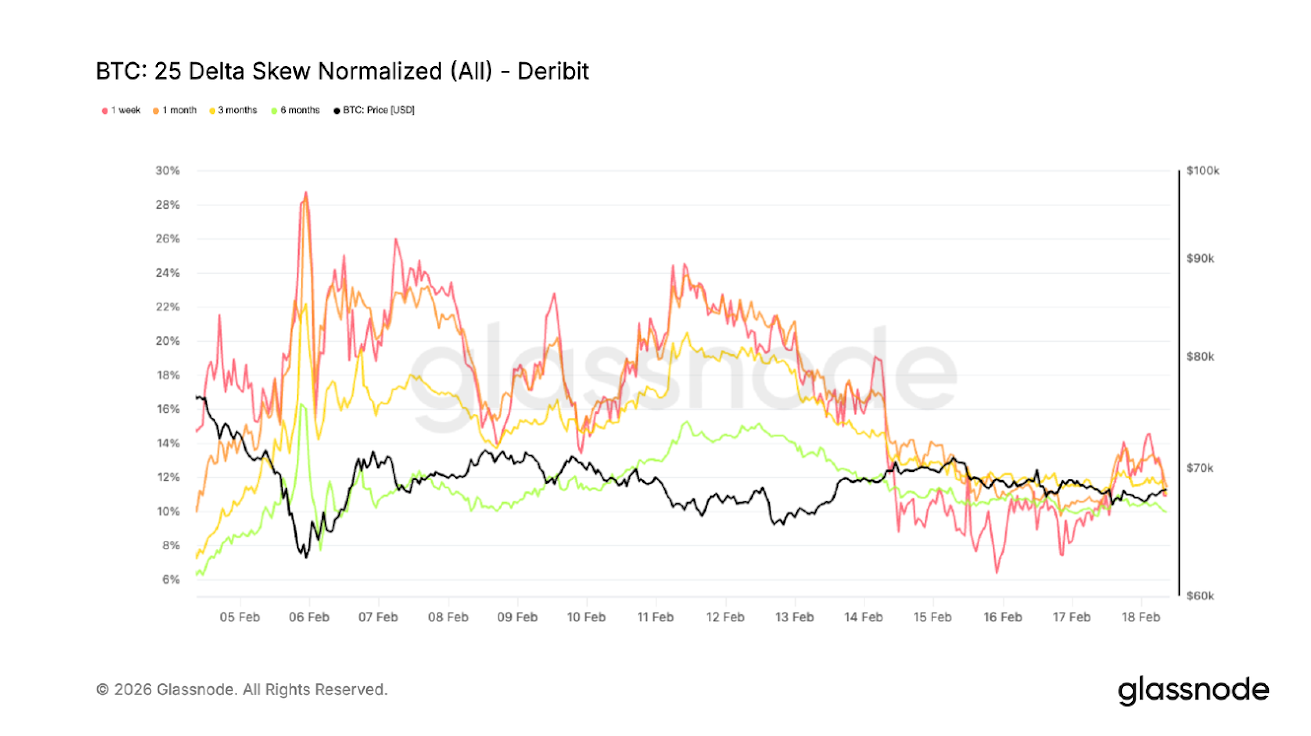 Source: Glassnode. BTC 25 Delta Skew Normalised (All) via Deribit, 05 February – 18 February, 2026
The 25-delta skew, which measures the volatility differential between downside puts and upside calls, has compressed meaningfully. A positive reading indicates that puts are priced richer than calls, signalling stronger demand for downside protection.

Following the retest of the $62,000 region, skew held near 20 percent. It has since eased to roughly 11 percent across tenors, marking a sharp nine-point moderation over recent sessions.
At the lows, puts traded at a significant premium as traders moved to secure downside protection. That urgency has subsided. However, skew remains elevated relative to pre-selloff levels, indicating that downside hedging is still favoured over upside exposure.
The post Distribution And ETF Fatigue Cloud Bitcoin’s Path To Recovery appeared first on Bitfinex blog.