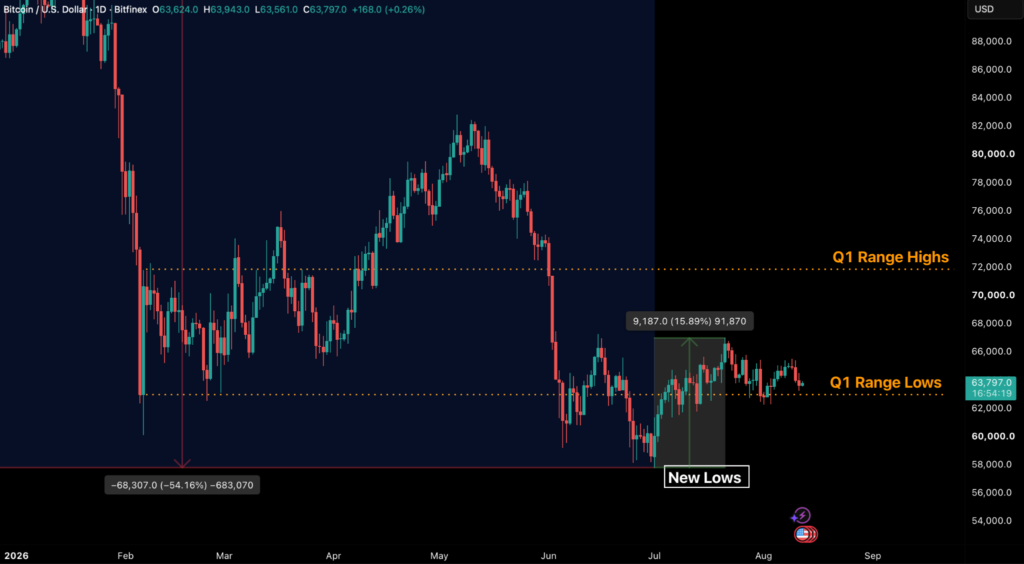
Equities spent the past two weeks setting all-time highs (ATH) while bitcoin met resistance at the same $65,000-65,500 region level six times. Between 5 and 10 August, the market printed six consecutive daily highs above $65,000 but bitcoin has not recorded a single daily close above that level since 26 July.
The S&P 500 closed Friday at a record 7,757.64 after its best week since April. The Nasdaq 100 also printed a 5.2 percent gain in the same week. Meanwhile, as of Tuesday’s close, bitcoin stands roughly 1.41 percent higher in August.
That underperformance is even more stark once liquidity and market capitalisation are taken into account. The major equity indices are over 50-60 times larger than BTC and more liquid, so the same implied move demands far larger capital inflows. In the current landscape, bitcoin and cryptocurrencies in general are showing real weakness relative to other risk assets.
At the start of August, we documented how the $62,000-$65,000 floor had successfully absorbed selling pressure. In the past week we have seen similar market behaviour, as we saw the most consequential on-chain event of 2026 so far took place with long-term holder supply recording its first weekly decline of the year. The pricing of the coins that moved shows genuine loss-taking, but by this cohort’s youngest members rather than any of the older hands.
In today’s analysis we go through the failure of price to move above $65,000, the identity of the seller and how the BTC options market is pricing today’s Consumer Price Index (CPI) release as a non-event.
Six Taps, No Acceptance
The six daily highs above $65,000 between 5 and 10 August produced zero daily closes above this level, with the rejection of any sustained price move always coming faster than the advance that preceded it. In July the market broke $63,000, the Q1 range lows, seven times and reclaimed it on every attempt. Since 5 August the same test has been run, but at $65,000, with the same result and the same volume signature.
Absolute volumes have also declined substantially. Two of the past six price retests, which occurred on 8 and 9 August, printed spot volume of 118 and 165 BTC on Bitfinex, and have been the two thinnest sessions of the past 30 days. Monday’s 2.41 percent peak-to-trough decline in BTC, and Tuesday’s 1.95 percent decline transacted roughly three times as much daily volume.
The picture is one which demonstrates that there is limited conviction to push the price in either direction, raising the probability that the $62,000-65,000 range will hold until a significant catalyst moves price. When a range extreme is retested on much lower volume than the middle of the range sees, it typically points to range continuation.
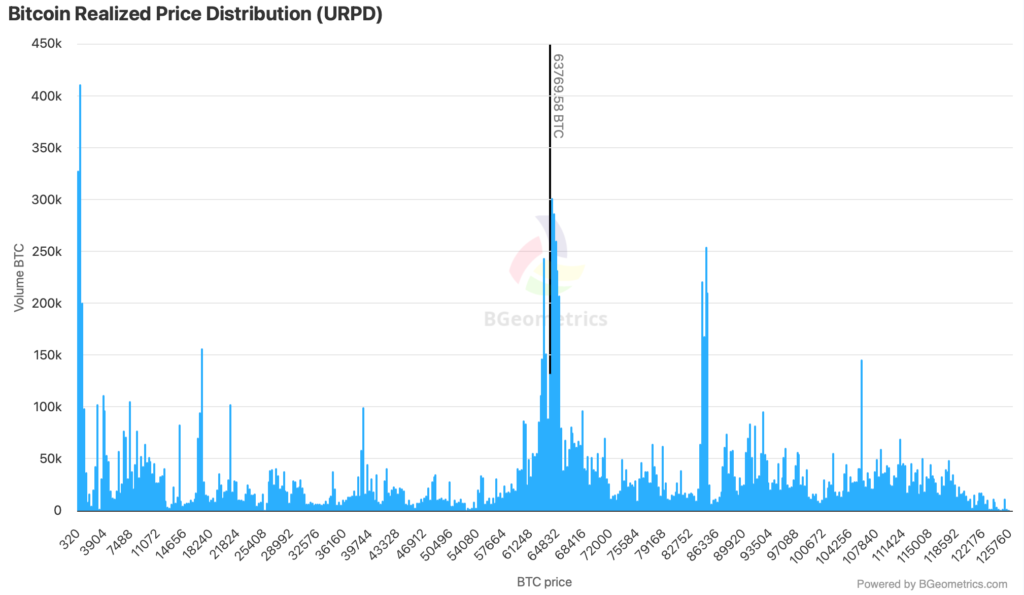
The reason the boundaries are so stubborn is due to ownership. The $62,000-$65,000 band holds 1,794,308 BTC at this cost basis, 8.93 percent of circulating supply per the UTXO Realised Price Distribution (URPD), with the largest holdings at ~$63,800.
With price trading inside this band, the largest concentration of holders across any narrow $3,000 range keeps moving between profit and loss and a large volume of coins changes hands as a result. That’s typical holder behaviour. A breakout needs fresh demand, absent supply, or both. This week delivered neither and for the first time this year the supply side can be identified in the cohort data.
Who Actually Sold
Long-term holder supply (defined as holders of longer than 155 days) has fallen by roughly 210,000 BTC from its 29 July peak at 16.82 million BTC, the first weekly decline of 2026 and the largest two-week drop since December 2024.
A decline in this metric does not automatically mean selling, because coins can leave the long-term holder bucket for a number of reasons. Part of this drop is the custody migration that followed the Coldcard incident, where old wallets were emptied to new addresses rather than to exchanges.
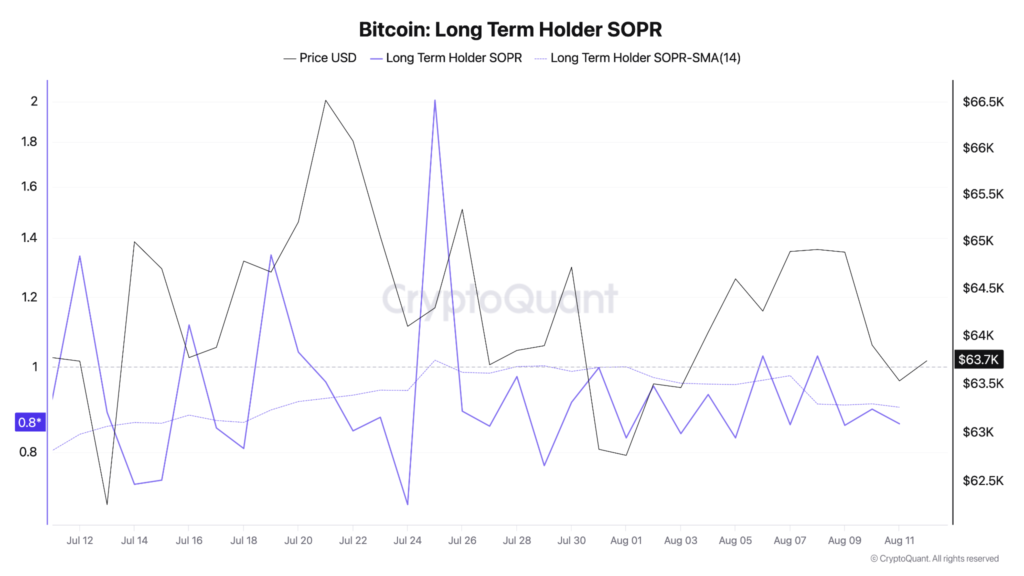
The spending data clarifies the picture. Long-term holder SOPR (Spent Output Profit Ratio), which compares the price at which moved coins were acquired, with the price at which they were spent, printed 0.86, 0.90 and 0.86 across 9 to 11 August. The average coin that left the cohort sold 10 to 14 percent below its purchase price.
Dividing spot by those ratios places the sellers’ average acquisition cost between roughly $71,000 and $76,000, which dates the coins to the October 2025 to March 2026 window. These are the youngest members of the cohort, buyers of the cycle top who have just aged past the 155-day classification threshold and are exiting underwater.
Long-term holder realised price has declined to $49,126 over the past fortnight, which matters because passive outflows should be pushing the price higher. Low-cost coins leaving through wallet migration lift the cohort average, so the average falls only when high-cost holdings are distributed in size.
The multi-year holder base within this cohort carries a realised price below $49,000 and is not the seller, so there is no mass exodus. Addresses holding more than 1000 BTC or whale balances reached a 2026 high to 3.06 million BTC as of 8 August, this puts the largest entities on the other side of the trade.
What changed this week is the arrival of buyers at the top of the range, entering long-term holder status. Losses dominating cohort spending is the behaviour of a late-stage bear market rather than a distribution top.
Volatility Prices a Non-Event
Deribit’s 30-day implied volatility index closed at 33.8 on 8 August, its lowest close in roughly a year, and the at-the-money volatility covering today’s CPI release trades at 27 percent, compared to 42 percent, prior to the July Federal Open Market Committee (FOMC) meeting.
Implied volatility is the price of options, so a bottom-decile reading means the market is charging almost nothing for downside protection or upside participation. Option sellers, who collect premium and profit when the market moves less than that premium implies, have controlled this tape since late July because they have been consistently right. Bitcoin never left its range even when it dipped below $63,000 at the start of the month, or when we saw the surprise drop in payrolls on 7 August, so each successive week of sold options expired worthless for its buyers and every profitable expiry has invited more selling. The decline in implied volatility is that process compounding rather than a one-day event.
When IV is compressed over multiple weeks and volatility selling does not slow down, as is happening at the moment, we typically see an IV spike with a large price move along with it. Typically, this happens within 5-9 weeks of IV compression. That would align with the range breakout, but the data doesn’t support it happening this week.
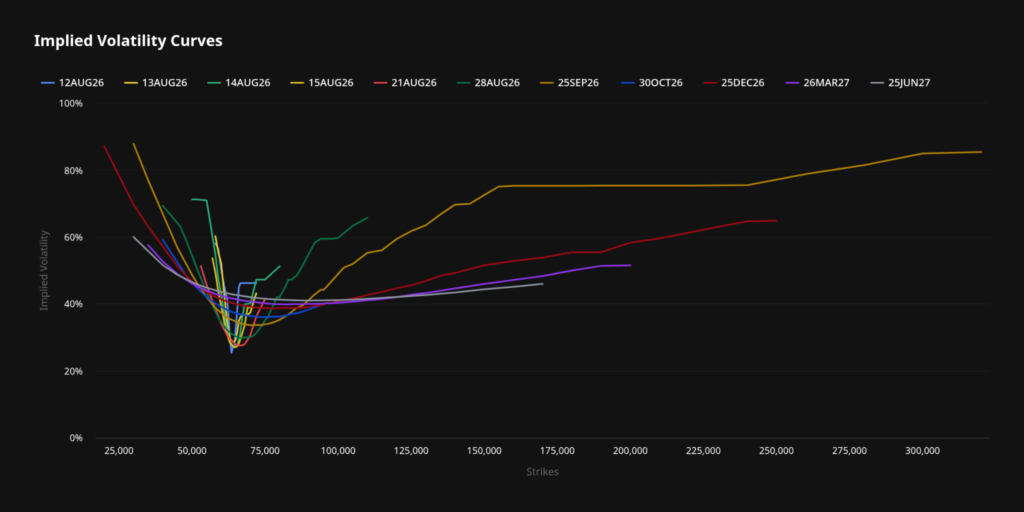
The little premium that does exist has a direction and a date, and both are informative. The nearest-strike measurement indicates -2.4 points for 14 August, -3.6 for 28 August and -3.8 for 25 September. Total put-to-call open interest of 0.57, meaning more calls outstanding than puts, and neutral perpetual funding, complete a derivatives picture that is neither leveraged long nor positioned for a break.
With a 9 percent of circulating supply carrying a cost basis between $62,000 and $65,000, every move inside the band runs into holders transacting around their own break-even, and that steady two-way business keeps daily moves small.
Skew tells the same story. The 25-delta risk reversal reads -2.4 points for 14 August, -3.6 for 28 August and -3.8 for 25 September: a put premium that is date-sized and concentrated around the September meeting, far from the five-point-plus regime we saw in late July. Total put-to-call open interest sits at 0.57 and perpetual funding is effectively neutral.
Our read is that positioning treats this pricing as self-reinforcing. With a 9 percent of supply’s cost basis inside the range, dealers sell both wings and their hedging pins price to the node. Cheap volatility at a six-tap ceiling is the market assigning low odds to acceptance in either direction.
The vulnerability in that consensus is arithmetic. The computed breakeven move for volatility buyers for the September month end expiry is 1.4 percent in either direction from the current spot price. This is a low bar for a print the Federal futures market itself is split on and an event that is several weeks away.
Records Next Door, a Coin Flip at the Fed
September hike odds moved from 65 percent 10 days ago to 44 percent on the payrolls miss and back to roughly 50 percent now. Equities reaching new ATHs have reset the odds of a hike to almost even.
The 10-year Treasury yield traced the same loop, from 4.7 percent at the start of the month to 4.63 on 9 August and back to 4.72 percent now, and none of it interrupted the S&P 500’s advance. Bitcoin’s failure to participate while carrying its strongest spot Exchange Traded Fund (ETF) bid since April is the cleanest measure of the internal supply problem set out above.
Today’s CPI release at 12:30 PM UTC carries a consensus of a 0.2 percent monthly increase after June’s 0.4 percent decline, with the annual rate expected at 3.4 percent from 3.5 percent.
We rank the signals to watch in this order. First, the flow response, whether the ETF run resumes or the outflow streak extends. Second, the cohort response on any test of $62,000-$63,000, whether the profitability gradient accelerates long-term holder loss-taking or exhausts it. Third, the rates reaction itself.
The range’s exits are unchanged. Upside requires acceptance above the $65,021-$65,510 band on a daily close. Two daily closes above $68,300, where the short-term holder cost basis meets the April monthly open, would end the structure entirely.
Key Metrics
Metric
Reading
Bullish Signal
Bearish Signal
Range $62,000-$65,000
Six daily highs above $65k, zero closes
Daily close above $65,510
Subsequent closes below $61,360
LTH cohort
First 2026 supply decline; SOPR 0.86-0.90
Supply stabilises, SOPR above 1
Decline persists at sub-0.90 SOPR
ETF flows
-$187.0m Mon-Tue after +$865.3m week
Green resumption, IBIT-led
Full red week
Options vol
DVOL 10th percentile; CPI straddle ±1.4%
Vol stays sold through CPI
28 Aug RR beyond -5 pts
Cost basis
53.6% supply in profit; STHCB $67,438 overhead
Holds above the $63,500 node
Sustained return below 50%
Whales
Balances 3.06m BTC, rising
Accumulation continues
Growth stalls into weakness

The post appeared first on Bitfinex blog.