
Bitcoin has held the key $77-80,000 support band flagged in Bitfinex Alpha 228, which contains within it both the True Market Mean (the average cost basis of active investors), now at $77,786, and the ‘new whale’ cost basis near $77,000.
Although the band has not been tested in full and BTC has not revisited the 24 October low of $79,250, the lows on 26 and 27 October have held, with consistent absorption of selling pressure by spot limit buyers.
The US Federal Reserve announces its rate decision at 18:00 UTC today (28 October), so this edition is built around factors that may determine market behaviour through to the end of the week and into next week. In particular we cover current market positioning and what the previous 71 Federal Open Market Committee (FOMC) decisions tell us about bitcoin’s behaviour on decision day and over the following week. We also look ahead to Friday’s month-end options expiry, tomorrow’s GDP and Personal Consumption Expenditures (PCE) price index readings and next week’s US midterm elections.
Positioning: Leverage Is at a Five-Week High Going into Fed Decision
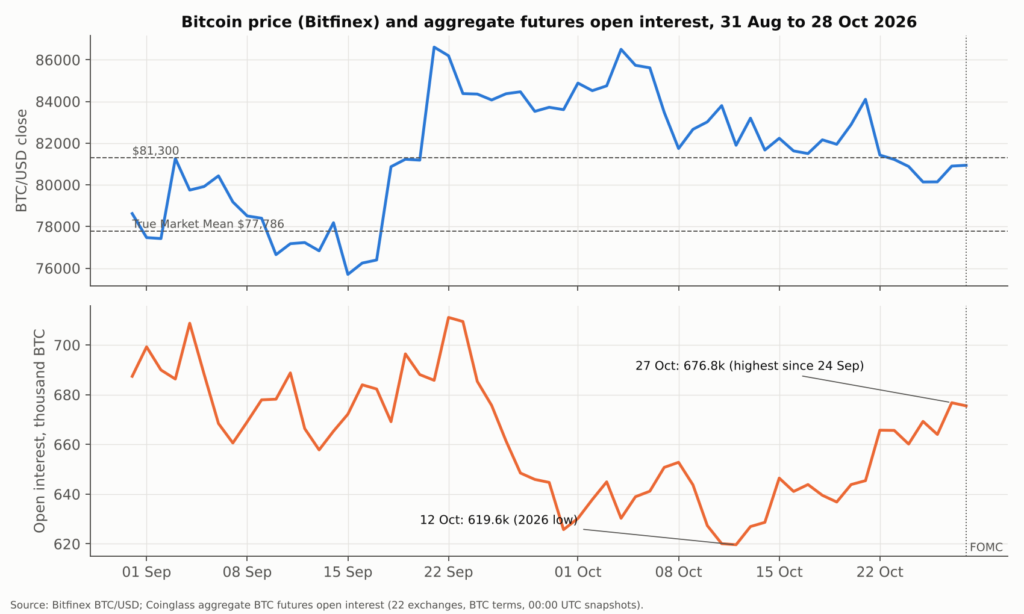
The most important change since we published Bitfinex Alpha issue 228 is the change in price support. Aggregate bitcoin futures open interest (OI), measured in BTC across the 22 exchanges tracked by Coinglass, continues to rise even as spot prices have drifted within the low $80,000 region. OI climbed from its 2026 low of 619,645 BTC on 12 October, when bitcoin traded at $83,723, to 676,761 BTC on 27 October, its highest level since 24 September, with bitcoin at $80,116. OI is 9.2 percent higher while bitcoin is 4.3 percent lower.
Figure: Bitcoin price and aggregate futures open interest, 31 August to 28 October 2026 (Source: Bitfinex, Coinglass)
Positions added as price falls are, on balance, dip-buying longs, and this is supported by current funding levels. The open-interest-weighted funding rate across venues was 9.8 percent annualised at 07:55 UTC today (28 October), up from 7.3 percent on 25 October, with longs paying shorts throughout. Liquidations over the past 24 hours were only $31 million for bitcoin, suggesting that this leverage has not been flushed; it is still open and still exposed to the Fed’s statement.
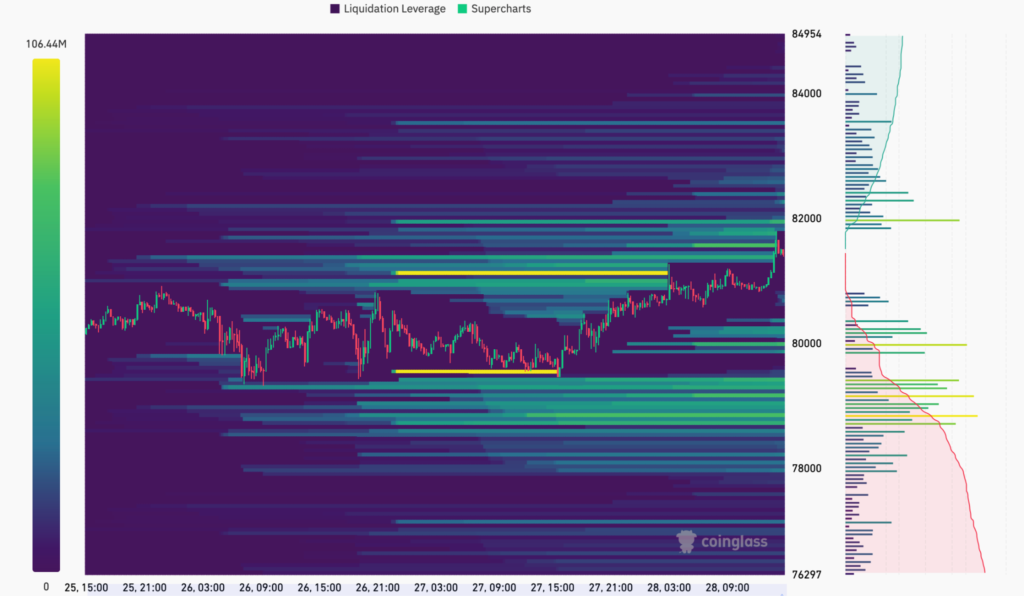 Figure 2: Bitcoin liquidation heatmap, showing the short liquidation clusters around $82,000 and the long clusters below $79,000 (Source: Coinglass)
As we explained in this week’s Bitfinex Alpha, the increase in OI on lower timeframes was partly dominated by shorts below $79,500. This was reflected in short-liquidation clusters appearing around $82,300. The price level of these clusters subsequently shifted slightly lower, likely as shorts added to their positions even as bitcoin rose. Much of this cluster has since been cleared, with more than $38.82 million in short liquidations recorded within just 15 minutes on 28 October, as bitcoin moved above $81,500.
A benign FOMC statement today and an equity uptick would squeeze more shorts towards the $82,500-83,000 short cluster, potentially extending the move towards the next major concentration of supply, which has a cost basis of $84,500 and above. A hawkish statement, by contrast, could trigger long liquidations if bitcoin falls below $79,000, where the first major liquidation clusters sit inside the support band.
Options price a modest, two-sided event: the 29 October straddle, the first expiry after the Fed statement, implies a move of about 1.6 percent, or $1,280, either way.
On-Chain: Dip Buyers Absorbed About 172,000 BTC as Profit-Taking Fades
While the derivatives book has become more crowded, spot demand has become more stable and, together, they explain why the support band has held so far. The unspent realised price distribution (URPD) band, which records the price at which each coin last moved, indicates that supply with a cost basis between $79,000 and $81,000 rose from about 453,000 BTC on 25 October to 624,587 BTC on 28 October. That is an increase of roughly 172,000 BTC in three sessions.
The overhead picture remained unchanged. A total of 884,312 BTC sits between $81,000 and $82,500 and 1,083,820 BTC between $84,000 and $85,500, all held at a loss. Every daily high since 24 October has stalled just under $81,300, consistent with holders selling into each recovery.
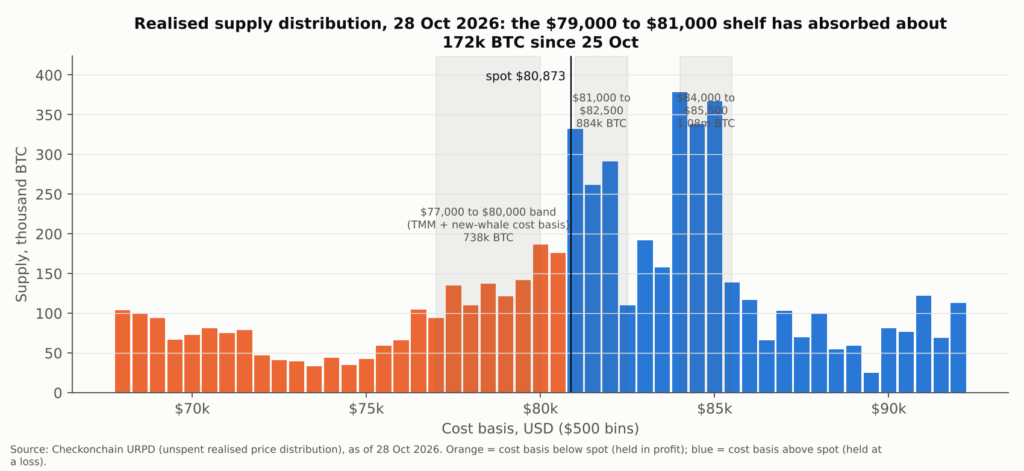 Figure 3: Realised supply distribution as of 28 October 2026, with the $77,000 to $80,000 band and the overhead supply zones marked (Source: Checkonchain)
Spot bitcoin Exchange Traded Fund (ETF) demand has returned this week (as of 28 October), but at a modest scale. Net inflows of $110.3 million on 26 October and $176 million on 27 October were the first consecutive inflows since the run from 19 to 21 October.
The profit-taking that drove the 22 October decline has since run its course. The short-term holder spent output profit ratio (STH-SOPR), which measures the ratio between the price at which coins held for 155 or less are sold and the price at which they were bought, peaked at 1.038 on 22 October, the highest since July, and has fallen every day since to 0.9997 on 27 October, its first print below 1 since 15 October.
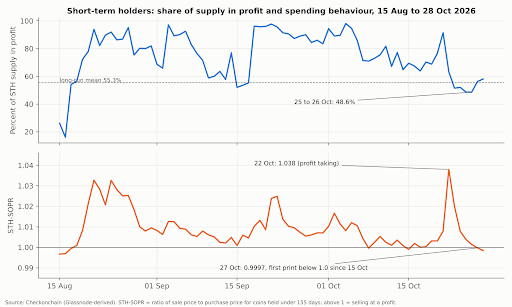 Figure 4: Short-term holder supply in profit and STH-SOPR, 15 August to 28 October 2026 (Source: Checkonchain)
Based on on-chain movements, STHs are now selling at a small loss on average, which indicates that the sellers who had gains to take have largely taken them. The signature of a deeper correction has yet to appear. We would look for STH-SOPR to stay below 0.98 for several sessions, with aggregate supply in profit, now 66.4 percent, falling through 58 percent to call this a significant correction.
We read current market behaviour as a reset without a significant correction, amid currently low levels of volume and volatility.
The FOMC Playbook: What History Tells Us Comes Next
The Fed is in a tightening cycle again. It raised its target range on interest rates to 3.75-4 percent on 16 September, its first increase since July 2023. The market overwhelmingly expects a hold on 28 October, followed by a rate increase in December.
Any immediate market reaction will therefore depend on the Fed’s statement, the structure of the FOMC vote and Chair Kevin Warsh’s press conference.
There have been 71 FOMCs since January 2018. Across those decisions, the data suggests that the decision day leans positive for BTC, but in the following week it gives back some of its gains. Bitcoin has averaged a gain of 0.9 percent on a Fed decision day, with 58 percent seeing the market closing higher, only to be followed by a loss of 0.6 percent over the next five sessions. The pattern applies to both holds (44 cases: a 1.1 percent gain, then a 1 percent loss) and rate increases (16 cases: 1 percent gain, then a 1.3 percent loss).
Secondly, tone matters more than the rate decision itself. Across 11 hawkish surprises, including June 2021, September 2022, October 2025 and June 2026, bitcoin averaged a loss of 1.5 percent on the day and 1.9 percent over the next five sessions, with only three of the 11 closing higher. Across nine dovish surprises, it averaged gains of 2.3 percent and 3.8 percent respectively. The five hawkish holds averaged a loss of 1.2 percent on the day and 4.1 percent over the following five sessions, making this statistic the closest historical comparison, if the Fed holds but hardens its language.
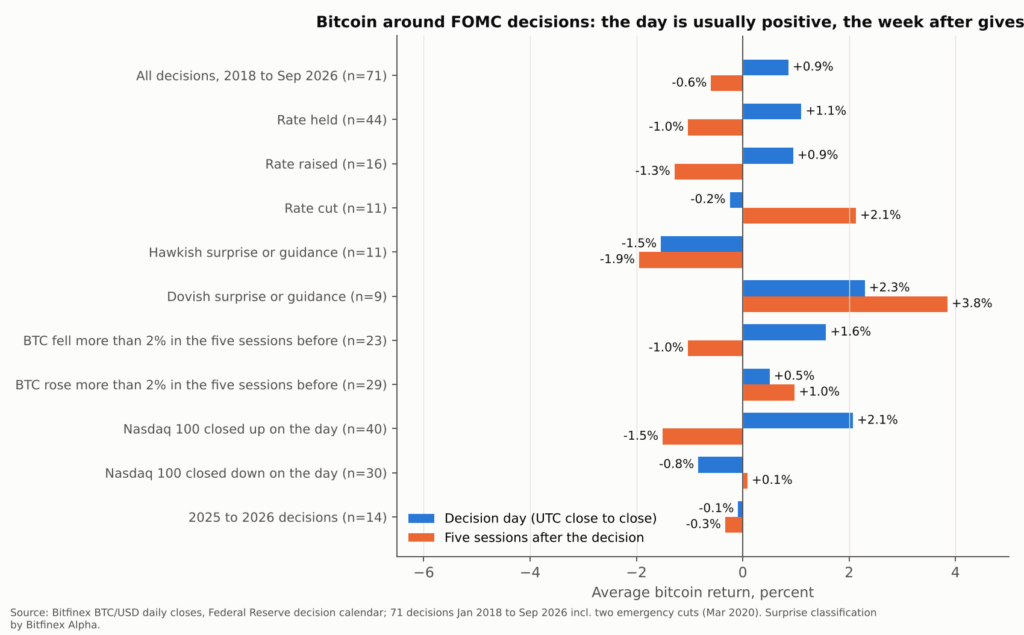 Figure: Bitcoin around FOMC decisions, 2018 to September 2026, conditioned on the action, the tone, the run-in and the equity reaction (Source: Bitfinex, Federal Reserve)
Thirdly, the run-in favours a positive decision day, while equities are likely to influence its direction. Bitcoin fell 3.8 percent over the five sessions into a decision. Across the 23 decisions where bitcoin had fallen by more than 2 percent in the run-up, it rose on decision day in 61 percent of cases, with an average gain of 1.6 percent — the strongest performance of any run-in bucket.
Bitcoin’s decision-day return has matched the direction of the Nasdaq 100’s on 65 percent of decision days, averaging a 2.1 percent gain when the index closed up, and a 0.8 percent loss when it closed down. The 30-day correlation between BTC and the Nasdaq 100 stands at 0.74 and today the large-cap tech stocks Microsoft and Alphabet report within two hours of the press conference. The equity reaction could therefore carry at least as much weight for BTC as the Fed’s words.
Historical data patterns
If the Fed holds and the December pricing stays near its current 73 to 78 percent, which, in our view, is the most likely outcome, history points to a modest gain of around 1 percent on the day. Historically, this gain has tended to fade over the following week. The upside case for the day is around $82,500, the upper bound of the short-liquidation cluster identified earlier this week in Bitfinex Alpha.
Given current perpetuals market positioning, this is where a potential short squeeze could lead, although holders of 884,000 BTC at a cost-basis between $81,000 and $82,500 could become short-term sellers again.
If the Fed holds but sounds more hawkish — firmer inflation language, three or more dissents in favour of a hike, or December pricing moving towards 90 percent — history points to a loss of around one percent on the day and further weakness over the following week. That would bring $79,250 and then the True Market Mean at $77,786 back into play, with the long-heavy perpetual futures book accelerating the move.
The takeaway is simple: a benign outcome has historically produced an initial gain that fades, while weakness following a hawkish outcome tends to persist.
Outcome at 18:00 UTC
Historical analogue (n; day; five sessions after)
What we expect in bitcoin
Confirmation to watch by Friday
Hold, one or two dissents, December hike pricing stays near 73 to 78 percent
Clean holds (34; +1.3%; minus 1.4%)
Positive day towards $82,300 to $83,000; relief sold into the $81,000 to $82,500 supply over the week
Nasdaq 100 up on the day after the Microsoft and Alphabet prints; funding below 7 percent with OI flat; ETF inflow above $300 million on 29 or 30 October
Hold with firmer inflation language, three or more hawkish dissents, December pricing towards 90 percent
Hawkish holds (5; minus 1.2%; minus 4.1%)
Retest of $79,250; a daily close below $80,000 opens the True Market Mean at $77,786
Long liquidations above $300 million in 24 hours with OI falling; STH-SOPR below 0.98; 10-year yield above 5.10 percent
Hold with Warsh playing down December, pricing falling below 60 percent
Dovish surprises (9; +2.3%; +3.8%)
Acceptance above $82,500 and a test of $84,000 to $85,500 within the week
Two consecutive ETF inflow sessions; ETH/BTC above 0.0298; real yield below 2.6 percent
25bp hike
No clean precedent since 2018; nearest: hawkish surprises (11; minus 1.5%; minus 1.9%)
Fast move through $79,250 towards $77,000 to $77,786; medium-term view changes on a daily close below the True Market Mean
OI falling more than 5 percent in 24 hours; supply in profit below 58 percent

The Week After: Expiry, GDP, PCE and the Midterms
The Fed decision is the first of four events within 10 days, including the 29 October Q3 GDP and September PCE readings, the 30 October $10.9 billion monthly options expiry, and the 3 November midterms. The options market is pricing across this cluster rather than around a single event. Implied volatility is 37.5 percent for the 29 October daily expiry, the first expiry after the decision, 35.2 percent for 30 October monthly expiry, then 38.1 percent for 6 November weekly expiry before easing to 35.7 percent for the 27 November monthly expiry. This implies traders are paying three to four volatility points for election week as a whole.
The 6 November straddle prices a move of 4.8 percent, or about $3,850, either way, implying a range of roughly $77,100 to $84,900 that brackets the True Market Mean on the downside and the ETF cost basis of $84,364 on the upside. For the time being, the election is being priced as part of a broader event cluster.
Figure 6: Bitcoin options term structure on 28 October 2026, at-the-money implied volatility and straddle by expiry (Source: Deribit Metrics)
What The Midterms Have Meant for Bitcoin and for Equities
Bitcoin has traded through three midterms elections, and in all three it was higher a year later: up 24.1 percent after 4 November 2014, 43.4 percent after 6 November 2018 and 92 percent after 8 November 2022. The near-term path was weaker. After 90 days, bitcoin was down 27.5 percent in 2014, and 46.5 percent in 2018, but up 22.6 percent in 2022. Over the same 90-day periods, the S&P 500 rose 0.4 percent in 2014, fell 1.1 percent in 2018 and rose 7.4 percent in 2022. Bitcoin therefore lagged equities after the 2014 and 2018 midterms, , but outperformed them in 2022.
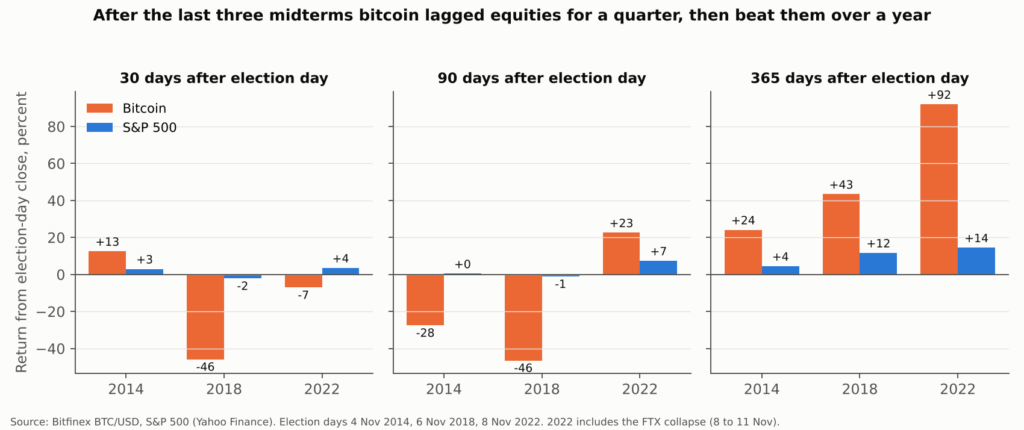 Figure: Bitcoin and the S&P 500, 30, 90 and 365 days after the 2014, 2018 and 2022 midterm elections (Source: Bitfinex, S&P Dow Jones Indices)
The caveat is that all three were halving-cycle trough years, with bitcoin down 51 to 58 percent for the year going into the vote and the cycle low still ahead, whereas bitcoin enters this election down nine percent for the year with the cycle low of $57,803 already printed on 1 July.
The midterms themselves do not produce a durable move. What followed depended on cycle position, which this time argues for a more constructive reading.
Equities add a longer historical record, and this matters because of the 0.74 correlation noted above: since 1950 the S&P 500 has risen in the 12 months after all 19 midterms, by an average of 15.1 percent against 7.3 percent in other years. One explanation is that the removal of election uncertainty supports risk sentiment. Prediction markets also point to relatively little uncertainty over the result: the Polymarket prediction market prices a Democratic House at 91.5 percent and a Democratic Senate at 66.5 percent. That reduction in uncertainty provides a potentially constructive backdrop for bitcoin into year-end, regardless of the immediate reaction to the Fed.
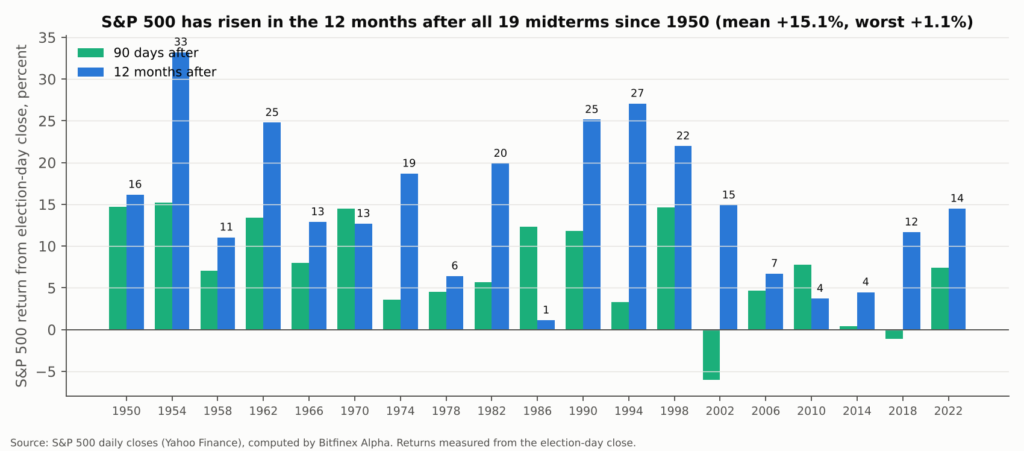 Figure: S&P 500 returns 90 days and 12 months after each midterm election since 1950 (Source: S&P Dow Jones Indices, Bitfinex Alpha calculations)
Altcoins: Twice the Drawdown, None of the Bounce and a Dominance Signal That Has Reset
Across 23 major altcoins on Bitfinex, the median drop from the October 21 close to the lows was 12.4 percent, against 5.8 percent for bitcoin, a ratio of 2.1 times. The subsequent recovery has offered no additional beta, with the median altcoin rising 1.1 percent since the October 25 close, virtually matching bitcoin’s 1.2 percent gain.
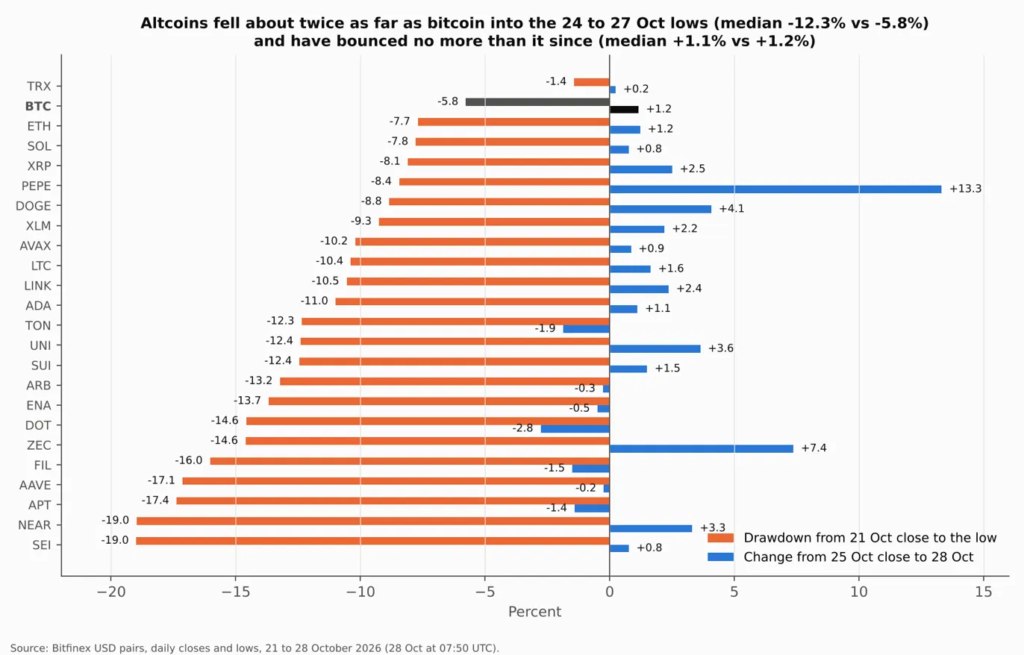 Figure 9: Drawdown from the 21 October close to the low, and change since the 25 October close, bitcoin and 23 large altcoins (Source: Bitfinex)
The positioning signal we flagged in our 15 October Intelligence Update has now reset. Altcoin OI (excluding ether) exceeded bitcoin OI on Coinalyze’s dominance measure in late September and early October, and in each previous instance (December 2024 and September 2025) that crossover marked a local top for altcoins against bitcoin, with the median altcoin falling two to three times as far as bitcoin over the following weeks.
The flip has since been corrected: bitcoin’s share of global OI is back at its highest since early September, which indicates that the leveraged altcoin longs built in late September have been liquidated or closed through the October pullback.
The reset removes the main source of altcoin underperformance but does not by itself start the rebound, which has historically required bitcoin to lead. Until ETH/BTC reclaims 0.0298 we would expect any post-FOMC bounce to be led by bitcoin with altcoins following at a lag, and any decline to hit altcoins roughly twice as hard, though with less leverage left to liquidate than at the start of the month.
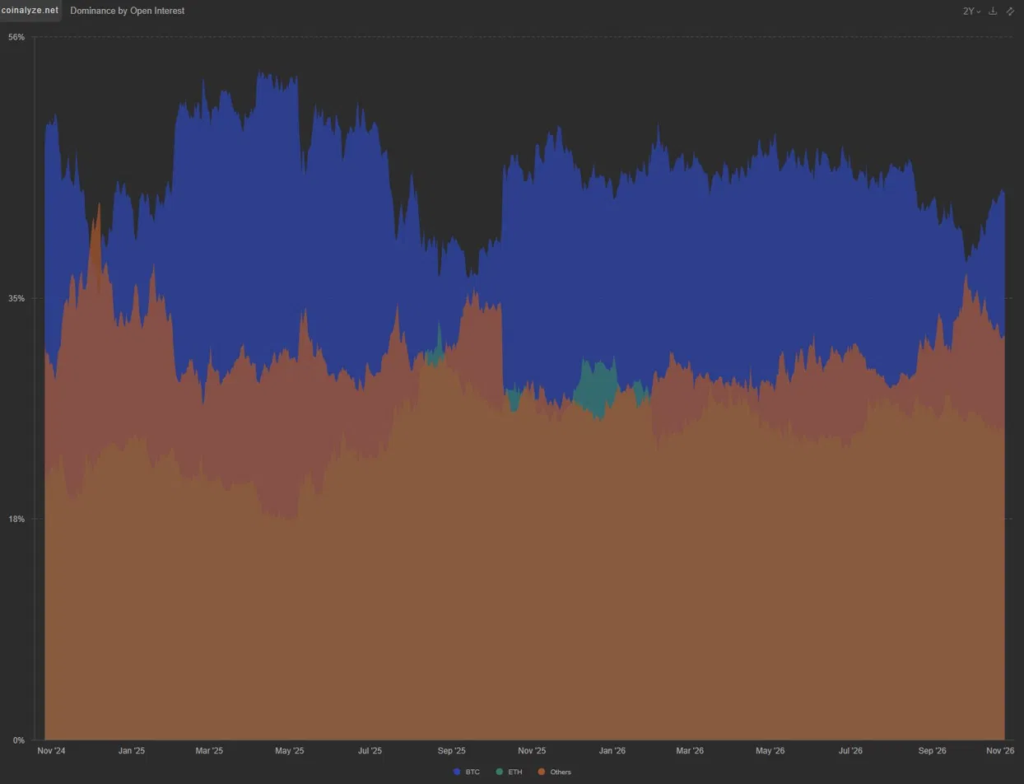 Figure 10: Dominance by open interest, bitcoin against ether and all other altcoins, November 2024 to October 2026 (Source: Coinalyze)

The post appeared first on Bitfinex blog.