Few things frustrate traders more than a false breakout. You sell the breakdown, only to watch the price recover yet again. You buy the recovery, only for momentum to disappear. After months of Bitcoin remaining stuck in a sideways range, the challenge is no longer spotting the breakout. It’s knowing whether it has the strength to last.
That’s where the Rate of Change (ROC) indicator comes in. Rather than predicting where price will go next, ROC measures whether price momentum is accelerating or fading, helping traders distinguish between genuine breakouts and false starts.
In this episode of Chart Decoder Series, we explore how traders use the Rate of Change (ROC) on Bitfinex to spot early shifts in trend strength and confirm breakouts using Bitcoin’s latest price action as a real-world example.
What is the Rate of Change?
Rate of Change (ROC) is one of the oldest and most straightforward momentum indicators in technical analysis. Rather than tracking price directly, it measures the percentage change in price between the current candle and the price a set number of periods ago.
The formula is simple:
ROC = ((Current Price − Price n candles ago) / Price n candles ago) × 100
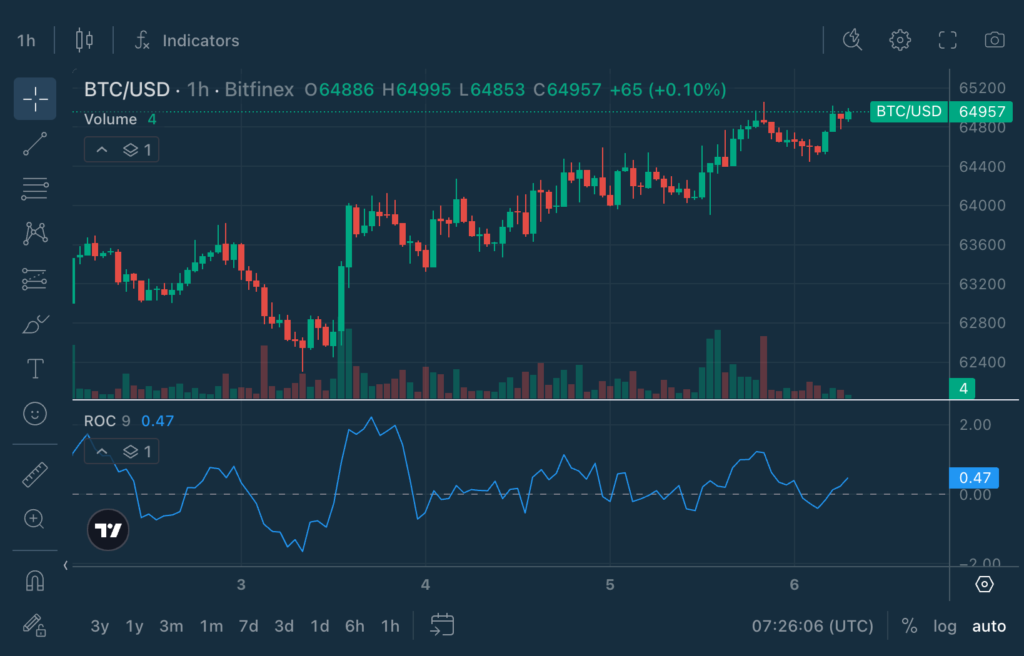
Bitfinex uses a default of 9 candles, so ROC compares the current price to the price 9 candles ago. In short, ROC tells you how much price has moved, in percent, since that earlier candle. In the above example, the ROC reads +0.47, meaning the current price is 0.47% higher than it was 9 hours ago (using Bitfinex’s default setting).
The result is plotted as a single line that oscillates around a zero line:
- ROC above zero: Price is higher than it was a few periods ago, so momentum is positive.
- ROC below zero: Price is lower than it was, so momentum is negative.
- ROC near zero: Price hasn’t changed much, meaning momentum is relatively flat.
Because ROC has no fixed upper or lower boundary, it captures the raw speed of a move. The further ROC travels from zero, the stronger the momentum in that direction. This is what makes it such a clean tool for spotting when a trend is accelerating, or quietly losing power.
You can set any lookback setting on Bitfinex. Most traders use a lookback period of 9, 12 or 14 candles. Shorter settings react faster and pick up more noise. Longer settings are smoother but slower to respond to price changes.
How to Read the Rate of Change
It all comes back to the zero line.
- Zero-line crosses. A cross above zero turns momentum positive, a cross below turns it negative and a drift back toward zero means the current move is slowing down. A cross tells you price has flipped versus where it was, so plenty of traders use it as a basic momentum trigger. It works best with some trend context, though, not on its own.
- Divergence. If price makes a new high but ROC makes a lower high, momentum’s fading even as price climbs, which is a common early warning that a rally’s getting tired. If price makes a new low but ROC makes a higher low, selling may be easing off underneath, which can hint at a bottom forming.
Keep in mind: ROC measures speed, not the direction of the larger trend. A high ROC reading tells you a move is fast, not that it will continue. Always combine ROC with price structure, support and resistance, or indicators like RSI and MACD for confirmation.
ROC vs RSI vs CMF: What’s the Difference?
At first glance, Rate of Change (ROC), Relative Strength Index (RSI), and Chaikin Money Flow (CMF) can all seem to play with a center line and measure momentum. In reality, each looks at the market from a different angle.
Rate of Change (ROC) is an unbounded indicator that fluctuates around a zero line.
- It’s concerned with speed. It measures how much the price has changed compared with a set number of candles ago. A move above the zero line tells you price is now higher than it was previously, signalling positive momentum. A move below zero indicates negative momentum. It does not tell you when a move is “overextended.”
- ROC asks: “How fast is the price moving?”
Relative Strength Index (RSI) is bounded between 0 and 100 and is centred around 50, with the commonly watched overbought and oversold levels at 70 and 30.
- It focuses on momentum exhaustion. It is designed to flag whether buying or selling has become stretched, making it better for identifying potential overbought or oversold conditions.
- RSI asks: “Has the move gone too far?”
Chaikin Money Flow (CMF) is unbounded and oscillates around a zero line.
- It looks at capital flow. By combining price and volume, it estimates whether buyers or sellers are controlling the market. A move above zero suggests buying pressure dominates, while a move below zero points to stronger selling pressure.
- CMF asks: “Is real money backing the move?”
Why ROC and CMF Can Tell Different Stories
Although ROC and CMF both use a zero line, they measure different aspects of market behaviour.
A quick price move can shoot ROC up while CMF stays flat or even dips. That tends to happen when liquidity’s thin and a few trades push price around, or during a short squeeze, where traders closing shorts drive the price higher without much fresh buying coming in.
When ROC and CMF rise together, that’s different. Price is speeding up and there’s real buying behind it. A lot of traders treat that as a stronger sign the move means something,

Rate of Change in Action
Let’s look at the BTC/USD 1-hour chart on August 6th, 2026.
After repeatedly defending the $63,000 area over the past month, Bitcoin has climbed back towards $65,000, printing a series of higher highs and higher lows. As Bitcoin climbed from the $63,000 area towards $65,000, the ROC repeatedly recovered above the zero line after brief pullbacks, suggesting bullish momentum continued to re-emerge as the uptrend developed.
As Bitcoin approached resistance near $65,000, however, the ROC began to pull back even while price continued trading near its highs. This suggests that although buyers remained in control, the pace of the advance had started to slow. A weakening ROC does not necessarily signal a reversal, but it can be an early indication that bullish momentum is cooling.
More recently, after a brief period of sideways consolidation, the ROC has turned back above zero as Bitcoin once again tests the $65,000 level. This suggests positive momentum has returned, although traders will want to see the indicator continue rising if the breakout is to gain traction.
The next signal is straightforward:
- If Bitcoin breaks above resistance and the ROC continues rising, it would suggest buying momentum is accelerating and the breakout has stronger conviction.
- If Bitcoin pushes to a new high but the ROC fails to make a higher high or starts falling, it could indicate momentum is fading and the breakout may struggle to hold.
Bonus Read: What the Lower Timeframe Chart Is Telling Us
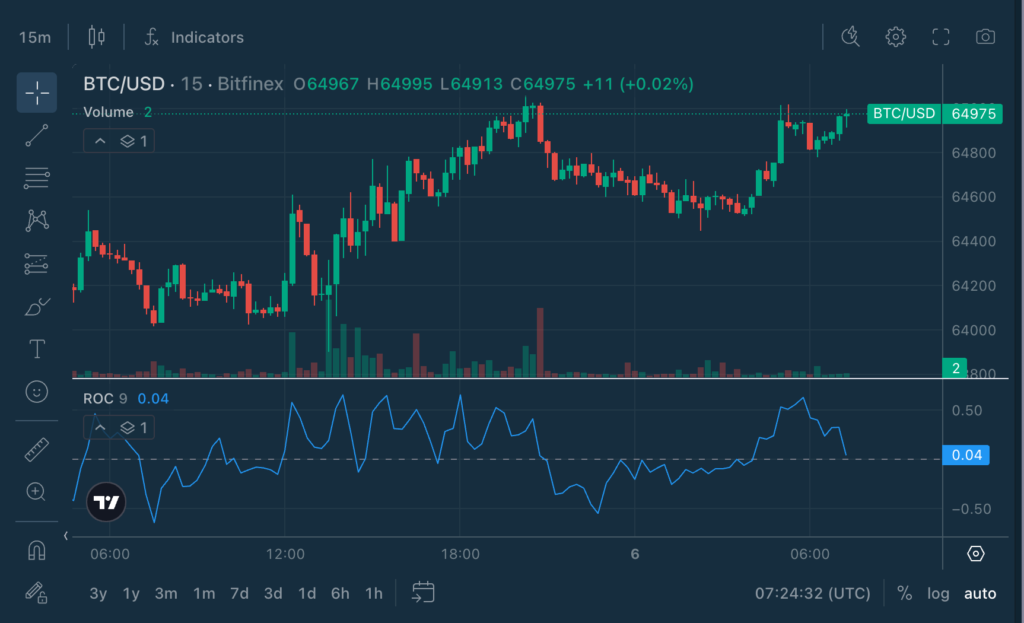
Let’s look at the BTC/USD 15-minute chart on 6 August 2026.
Bitcoin has climbed back towards $65,000, retesting its recent highs after a steady recovery. At first glance, the rally appears healthy, with the price continuing to edge higher.
The Rate of Change (ROC), however, tells a more nuanced story.
Although Bitcoin has returned to nearly the same price level, the ROC has made a noticeably lower high than during the previous rally. This means that while buyers are still pushing prices higher, they’re doing so with less momentum than before. In other words, the rally is continuing, but its pace has begun to slow.
This is known as a bearish divergence, where price makes a similar or higher high while momentum weakens. A bearish divergence doesn’t guarantee a reversal, but it can serve as an early warning that buying pressure is fading and the current move may be losing strength.
The next signal is straightforward:
- If Bitcoin continues making new highs while the ROC starts climbing again, it would suggest momentum is strengthening and buyers are regaining conviction.
- If the ROC continues making lower highs despite price remaining near $65,000, it would reinforce the view that the rally is running out of steam, increasing the risk of a pullback or further consolidation.
Shorter timeframes often reveal these subtle shifts in momentum before they become visible on higher timeframe charts, making the ROC a useful tool for traders looking to anticipate changes in market strength before they appear in price alone.
How to Use the Rate of Change
Watch the zero line first
- Crosses that align with the larger trend tend to be the most reliable.
- Crosses against the prevailing trend are more likely to fail and should be treated with caution.
Watch for divergence
Divergence is ROC’s most powerful signal.
- Bearish divergence (price higher, ROC lower) warns a rally may be tiring.
- Bullish divergence (price lower, ROC higher) hints selling pressure is easing.
- Divergence is a heads-up, not an entry — wait for price to confirm.
Match the lookback to your timeframe
- Shorter lookbacks (9) react faster and suit active trading.
- Longer lookbacks (14+) filter noise and suit swing setups.
- The right setting depends on how much sensitivity you want.
Pair it with structure
A momentum signal means more when it lines up with something real.
- A zero-line cross or divergence at a major support or resistance level carries far more weight than one in empty space.
- Momentum shifts confirmed by price breaking structure are the most reliable.
Power Combinations
ROC + Moving Averages
Moving averages define the bigger trend; ROC times the momentum.
- If price is above the 50-day moving average and ROC crosses above zero, the bullish signal has supportive context.
- If price is below the 50-day moving average and ROC crosses below zero, the bearish signal has more weight.
ROC + RSI
RSI tells you how stretched the move is; ROC tells you how fast it’s moving.
- If ROC turns up while RSI is recovering from oversold, momentum may be genuinely improving.
- If ROC diverges while RSI is overbought, the move may be exhausting.
ROC + MACD
MACD confirms momentum shifts.
- A ROC zero-line cross that lines up with a MACD crossover signals real conviction.
- Conflicting signals between the two suggest waiting for confirmation.
ROC + Support and Resistance
- A momentum shift that occurs right as price clears horizontal resistance is a high-quality signal.
- A ROC breakdown below zero that also loses major support warns of further downside.
This helps traders avoid treating every momentum shift as equal.
ROC + CMF
ROC shows whether price momentum is accelerating, while CMF reveals whether buying or selling pressure is supporting that move. When both rise together, momentum is backed by genuine market participation rather than thin liquidity or short covering.
Try it on Bitfinex
- Log into Bitfinex
- Choose any trading pair chart
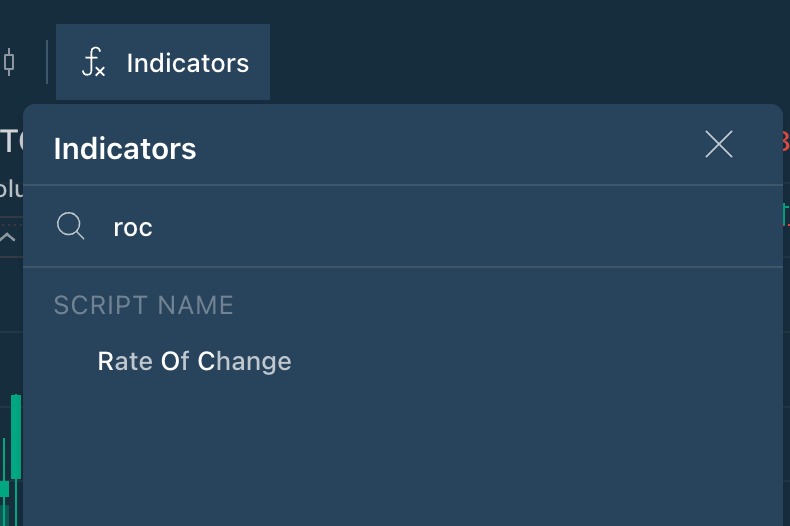
- Add “Rate of Change” (or “ROC”) from the Indicators menu
- Set your lookback period (9–14 is a common starting point; shorter periods react faster, longer periods filter more noise)
- Watch whether ROC is above or below zero, whether it’s expanding or fading, and whether it’s diverging from price. Use it alongside RSI, MACD, or moving averages for stronger confirmation
- Leverage Bitfinex’s zero trading fees to implement your strategies with zero trading costs
Bitfinex. Master Your Universe.

Explore the full Chart Decoder library:
- SMA vs EMA for trend direction
- MACD for momentum shifts
- RSI for overbought/oversold zones
- Bollinger Bands for volatility and price extremes
- Stochastic Oscillator for timing reversals
- VWAP for fair price detection
- Volume + OBV for spotting smart money flow
- ATR for volatility-based risk management
- Fibonacci Retracements for market pullbacks
- StochRSI for precision timing
- Ichimoku Cloud Part 1 for understanding the 5 components of the cloud
- Ichimoku Cloud Part 2 for mastering Cloud components & powerful indicator pairings
- Accumulation/Distribution for detecting institutional buying and selling
- Money Flow Index for tracking the strength of buying and selling pressure
- Chaikin Money Flow for confirming real capital flow
- Volume Profile Visible Range for broader market value zones
- Volume Profile Fixed Range for isolating where value is building inside a move
- Parabolic SAR for spotting potential trend reversals
- Donchian Channels for catching breakouts
The post appeared first on Bitfinex blog.