Welcome back to the Chart Decoder Series, your guide to mastering the charts and your trading universe.
You’ve probably seen it happen. Markets rally sharply, only to reverse days later.
These moves are often driven by what larger traders are doing behind the scenes. As buying picks up, some players start selling into that strength. When momentum fades, price often follows.
This is playing out in real time. Bitcoin has plunged over 50% from its October 2025 all-time high of $126,000, briefly touching $60,000 on February 5, 2026, the sharpest crypto sell-off since the FTX collapse in 2022. More than $2.6 billion in leveraged positions were liquidated in a single 24-hour period.
During the sell-off, large holders were adding to their positions. Glassnode data shows that mega-whales (wallets holding 10,000+ BTC) maintained steady accumulation throughout the entire decline from $90,400 to $74,500 and beyond. Over a 30 day window, addresses holding 1,000+ BTC have added roughly 152,000 BTC to their positions, pushing total whale-held supply to 3.2 million BTC, the highest level since 2024 signaling massive whale accumulation while retail panics.
For 13 years, Bitfinex has been the chosen home to many of the biggest institutional players who actually move markets. Learning to track these “whales” when you trade on Bitfinex is one of the most powerful edges you can develop as a trader and adds another layer to you mastering your financial universe.
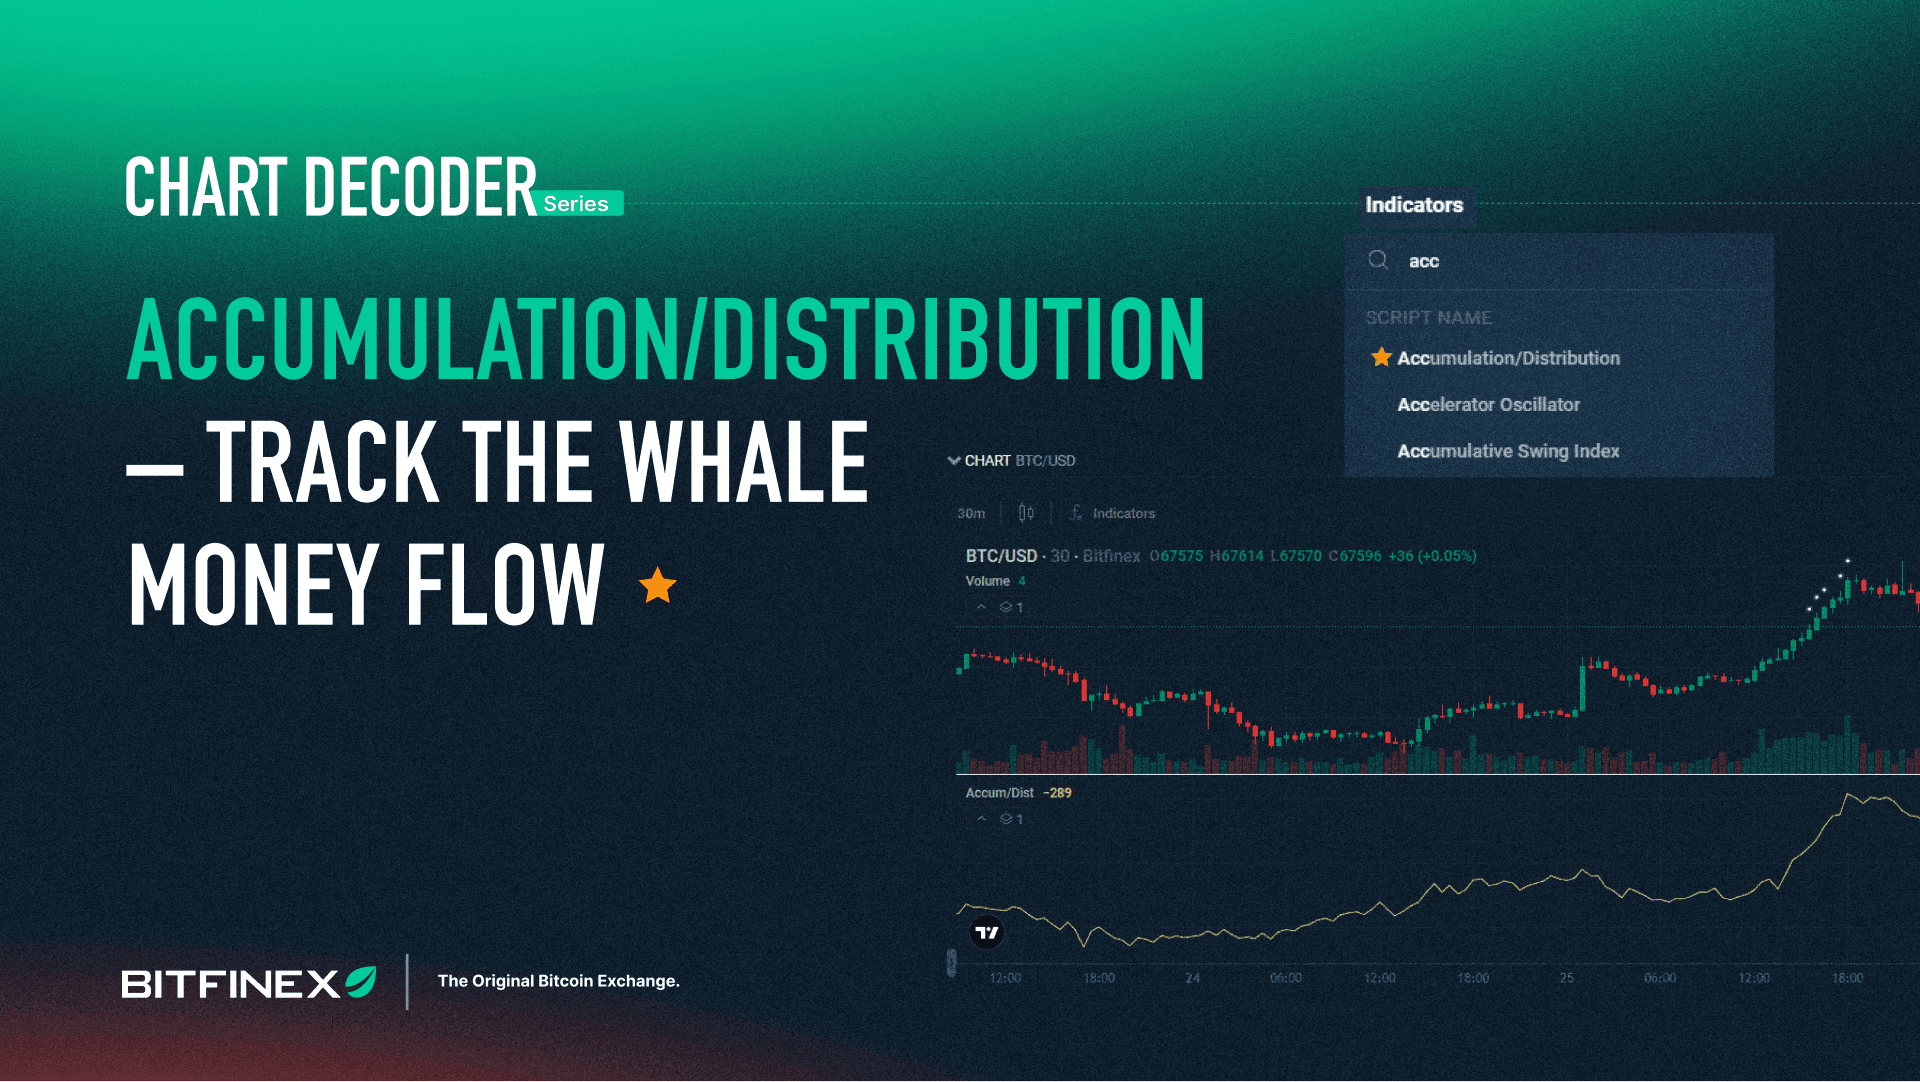
Today, we’re diving into Accumulation/Distribution (A/D), the indicator that shows you where the real money is flowing.
What is Accumulation/Distribution?
The Accumulation/Distribution (A/D) Indicator is a volume-based momentum tool developed by Marc Chaikin. It measures the cumulative flow of money into and out of an asset.
A stock can rally on light volume (weak move) or decline on heavy volume (strong move). The A/D Indicator weighs volume by where price closes within its daily range, revealing the real story behind price movements.
The core concept:
- Accumulation = Buying pressure (money flowing in)
- Distribution = Selling pressure (money flowing out)
The A/D line accumulates these values over time, creating a running total that shows whether smart money is entering or exiting positions.
How Does It Work?
The A/D calculation uses this formula:
Money Flow Multiplier = [(Close – Low) – (High – Close)] / (High – Low)
Money Flow Volume = Money Flow Multiplier × Volume
A/D = Previous A/D + Current Money Flow Volume
What this means in plain English:
- If price closes in the upper portion of its range → positive money flow (accumulation)
- If price closes in the lower portion of its range → negative money flow (distribution)
- The closer to the high, the stronger the buying pressure
- The closer to the low, the stronger the selling pressure
The indicator then accumulates these values, building a line that rises during accumulation and falls during distribution.
A/D vs OBV: What’s the Difference?
You already know OBV from our Volume episode. A/D works in a similar way, both track volume flow, but A/D reads deeper into each candle.
OBV (On-Balance Volume): is binary. If the price closes up, all volume is bullish. The price closes down, all bearish. It treats every volume candle as either 100% bullish or 100% bearish.
A/D (Accumulation/Distribution): A/D picks up whether buyers or sellers had the upper hand for most of the session. It looks at where price closed within each period’s range, whether that’s a day, an hour, or whatever timeframe you’re watching:
- Close near the high = buyers won
- Close near the low = sellers won
- Close in the middle = it’s a tie
Why this matters:
Say BTC closes $100 higher today with huge volume, but spends most of the day getting beaten down and only rallies at the last minute.
- OBV looks at that green close and counts the entire day’s volume as buying pressure.
- A/D sees that price closed near the bottom of the day’s range despite finishing higher. The rally was real, but sellers controlled most of the session.
Bottom line: A/D gives you a more accurate picture of who’s really in control- the whales buying or the whales selling.
How to Read A/D:
Rising A/D = Whale Money Flowing InBuying pressure exceeds selling. Institutions are building positions, the asset has strong support, and price appreciation is likely.
Falling A/D = Whale Money Flowing OutSelling pressure dominates. Smart money is exiting, revealing underlying weakness despite surface-level price action. Downside ahead.
Flat A/D = EquilibriumBuying and selling pressure are balanced. The market is undecided, often preceding a breakout in either direction.
Real Example: BTC/USD on Bitfinex
Let’s look at BTC/USD daily chart on Feb 11, 2026 with A/D and OBV loaded:
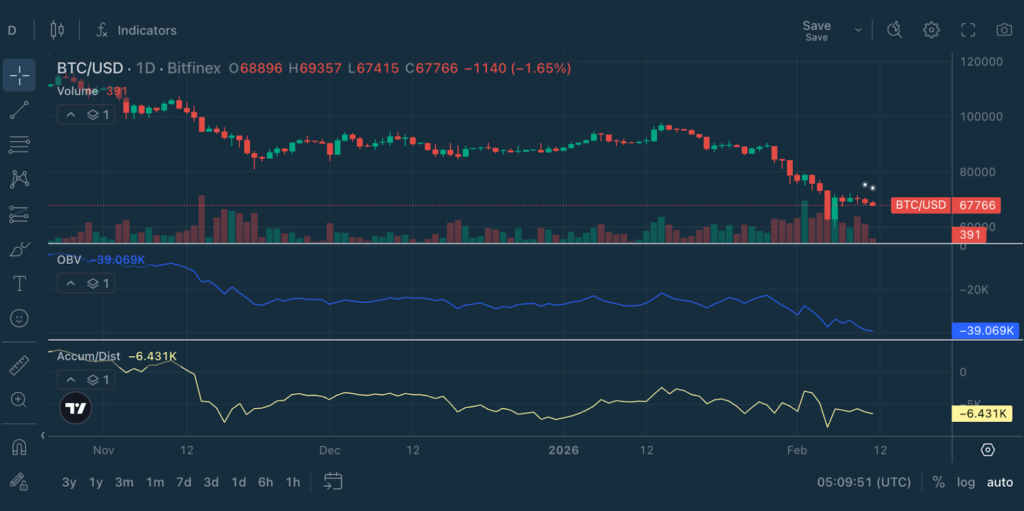
What’s happening on the BTC/USD daily chart (Feb 11, 2026):
- OBV: -39,068 – falling steadily since late January, steep decline
- A/D: -6,429 – dropped hard during the February 5 crash, but had sharp bounce and started to flatten since.
- Price: Hovering around $67,768
OBV sees red closes and keeps subtracting volume creating a steep decline – every down day looks equally bearish. A/D is reading the same sessions differently. Even though price is still closing red or flat, it’s closing in the upper half of the daily range more often, creating a flatter A/D line. Sellers are still present, but they’re not dominating the full session the way they were a week ago. Buyers are showing up before the close.
When A/D starts flattening while OBV is still falling, it can be an early sign of quiet accumulation – the big players positioning at these levels before it shows up in price. It doesn’t mean the bottom is in, and it’s not a trade signal on its own. But something is shifting beneath the surface.
Key Signals to Watch For
1. Trend Confirmation
- Rising price + Rising A/D = Strong uptrend with whale support
- Falling price + Falling A/D = Strong downtrend with whale selling
2. Bullish Divergence
- Price makes lower low, A/D makes higher low
- Meaning: Despite falling prices, whales are accumulating. Reversal may be imminent.
3. Bearish Divergence
- Price makes higher high, A/D makes lower high
- Meaning: Rally losing steam. Despite higher prices, whales are distributing.
4. Breakout Confirmation
- Valid breakout: A/D breaks out in same direction with volume
- False breakout: A/D diverges or stays flat
5. Volume Spikes During Consolidation
- A/D rising during consolidation: Quiet whale accumulation before breakout up
- A/D falling during consolidation: Quiet whale distribution before breakdown
Combining A/D with Other Indicators
A/D gets more useful when you pair it with the tools we’ve already covered in the series.
- A/D + RSI: RSI tells you the market is overbought or oversold. A/D tells you if volume agrees. If RSI says oversold but A/D is rising, that’s buyers stepping in. If RSI says overbought but A/D is falling, smart money may already be heading for the exit.
- A/D + Moving Averages: Price above the 50-day MA with a rising A/D line confirms the uptrend has real volume behind it. Price below with A/D falling confirms the downtrend. When they disagree, the trend may be weaker than it looks.
- A/D + MACD: MACD catches momentum shifts. A/D confirms whether volume supports the move. A bullish MACD crossover backed by rising A/D is a stronger signal than the crossover alone.
- A/D + VWAP: VWAP shows you fair value. A/D shows you what the big players are doing around it. Price sitting below VWAP while A/D rises? That could be quiet accumulation at a discount. Price above VWAP while A/D falls? Distribution into strength.
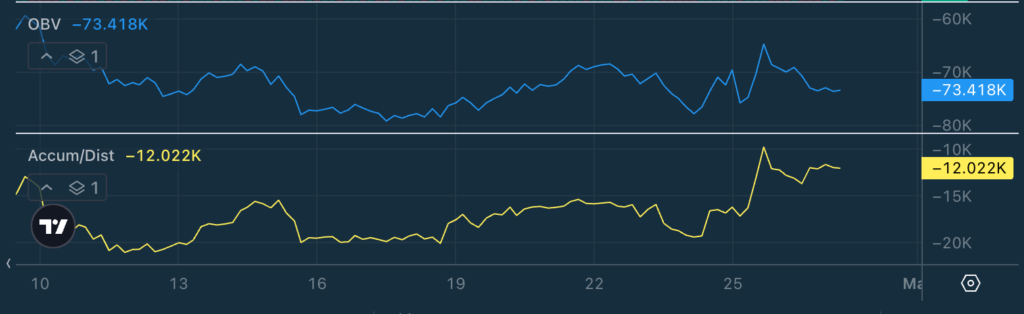
Bonus Read: BTC/USD Weekly Chart (Feb 11, 2026)
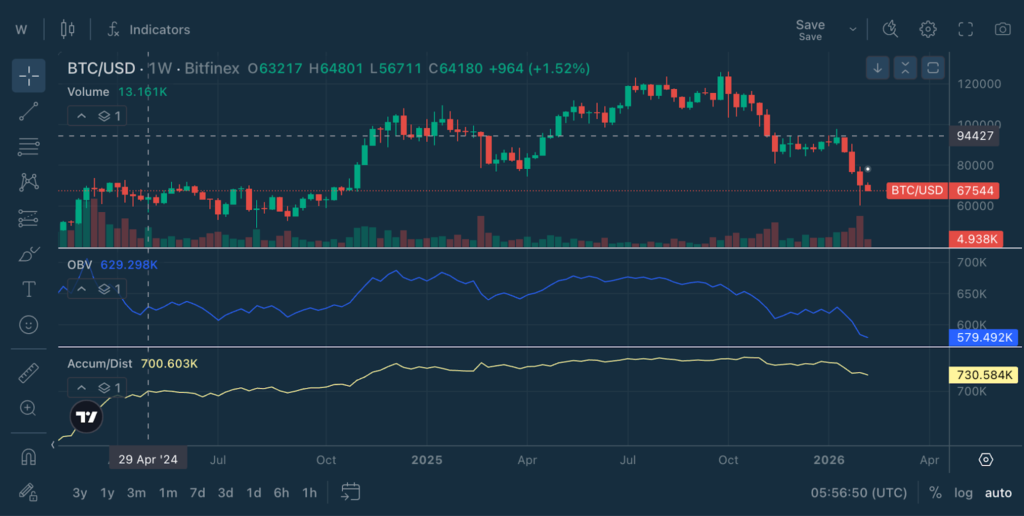
- Price: $67,544 – falling steeply from $126,000 in October 2025
- OBV: 579,492 – falling steeply since October, accelerating to the downside
- A/D: 730,584 – flat to slightly rising through the entire sell-off
Price has dropped nearly 50% and OBV confirms it. Weeks of red closes are pulling the line lower. If you only looked at OBV, everyone’s selling.
But A/D is seeing something else. Despite one of the sharpest corrections since 2022, the A/D line stayed rather flat. That means within each weekly candle, price is consistently closing in the upper portion of its range, even on weeks that finish red overall. Buyers on Bitfinex show up within the session, absorbing supply before the week ends.
This could be a pause before another leg down or the early stages of a reversal. But when A/D holds steady through a 50% crash on a weekly timeframe, it’s worth paying attention to. Some players are quietly accumulating while the rest of the market panics.
Common Mistakes to Avoid
Ignoring price action
A/D is a confirmation tool, not a standalone signal. Always combine it with price structure, support/resistance, and candlestick patterns.
Trading divergences too early
Wait for price confirmation before entering. A divergence alerts you to potential reversal, but price must confirm before the trade becomes valid.
Using A/D in choppy, low-volume markets
A/D works best in trending markets with healthy volume. In sideways, illiquid conditions, signals become unreliable.
Forgetting timeframe context
What appears as a divergence on the 1-hour chart may be insignificant on the daily chart. Always check multiple timeframes for confirmation.
Overcomplicating the setup
Keep it simple. A/D’s power lies in its straightforward message: is money flowing in or out? Don’t overcomplicate with too many additional indicators.
Try It on Bitfinex:
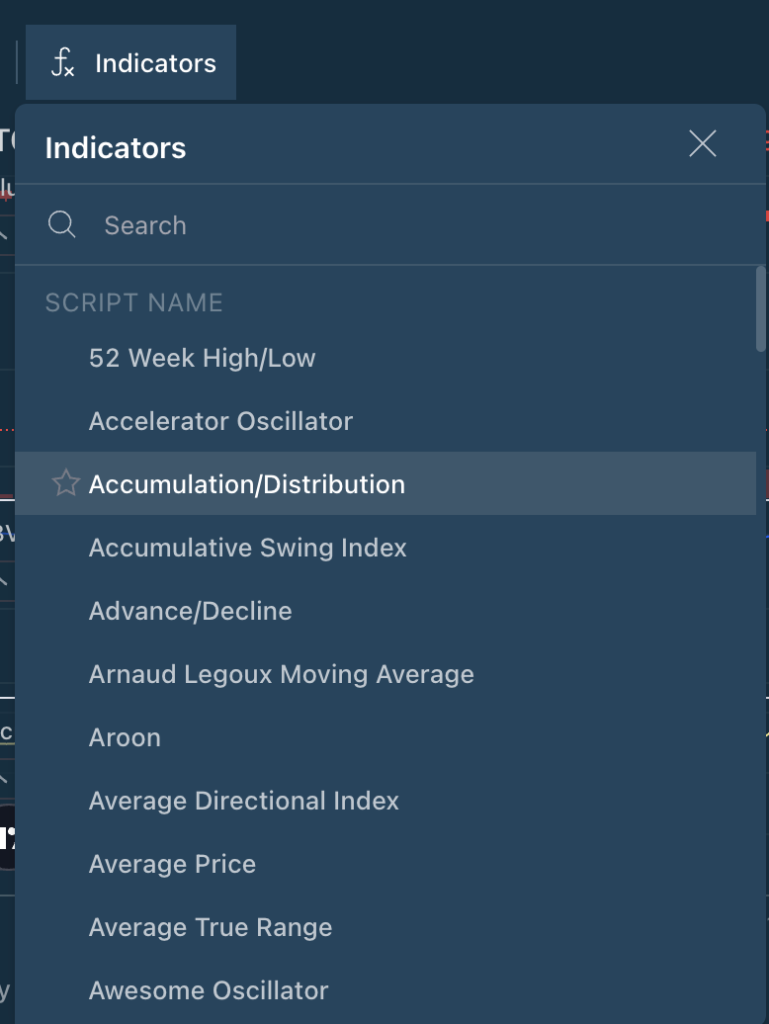
- Log into Bitfinex
- Choose any trading pair chart
- Add “Accumulation/Distribution” from the indicators menu
- Watch how the A/D line moves relative to price
- Look for divergences, confirmations, and volume flow patterns
Explore the full Chart Decoder library:
- SMA vs EMA for trend direction
- MACD for momentum shifts
- RSI for overbought/oversold zones
- Bollinger Bands for volatility and price extremes
- Stochastic Oscillator for timing reversals
- VWAP for fair price detection
- Volume + OBV for spotting smart money flow
- ATR for volatility-based risk management
- Fibonacci Retracements for market pullbacks
- StochRSI for precision timing
- Ichimoku Cloud Part 1 for understanding the 5 components of the Cloud
- Ichimoku Cloud Part 2 for Mastering Components & Powerful Indicator Pairings
The post appeared first on Bitfinex blog.