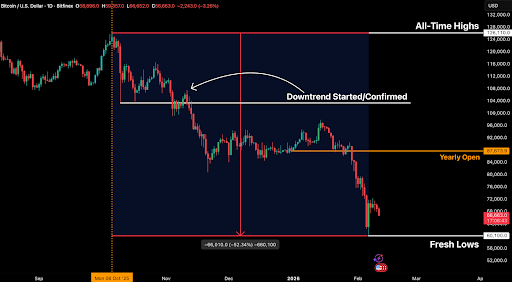
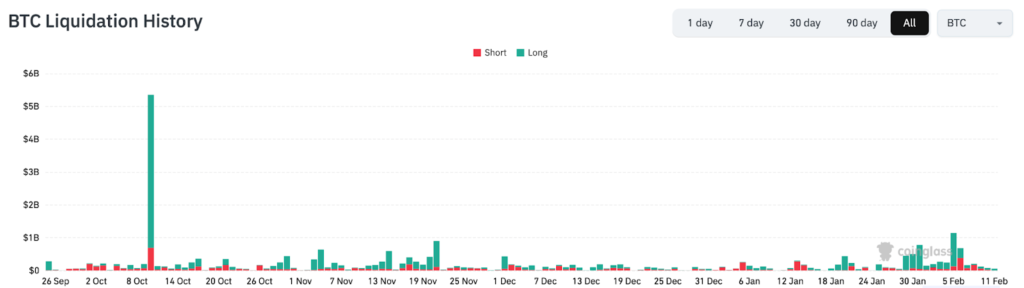
Since the break below our 10/10 lows, which marked the largest liquidation event in crypto history, the market has been in a downtrending phase.
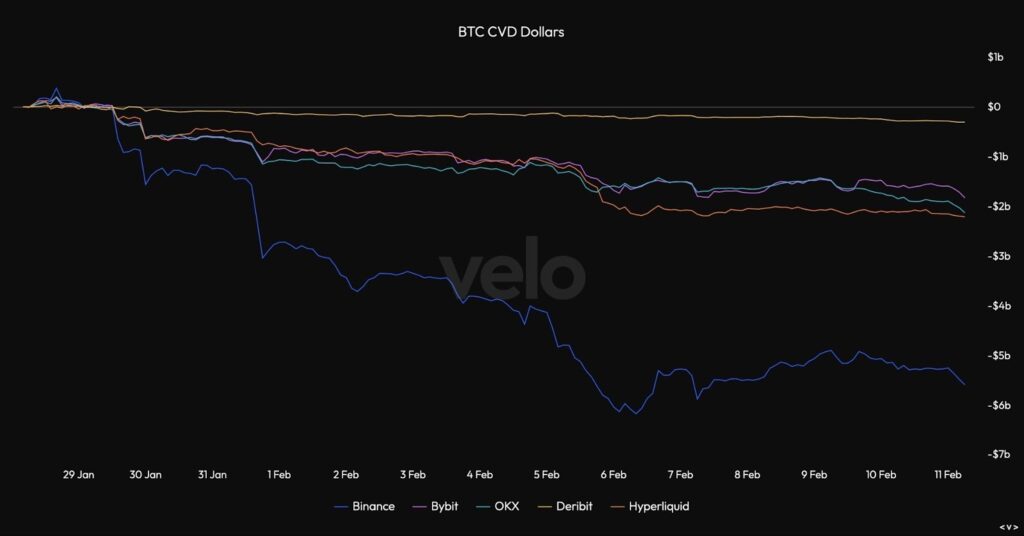
The latest leg down was not driven by liquidations but rather by aggressive spot selling. The spot volume delta metric highlights that the same entity (or a group of entities) have been distributing supply particularly during peak US sessions during UTC 6:00 – UTC 10:00 and UTC 13:00 – UTC 16:00. A majority of the distribution came between January 31st to February 5th and has since stabilised. This selling pressure also correlates with routine deposits onto exchanges
Selling pressure has also been exacerbated with heavy US Bitcoin ETF outflows during the same period. ETFs have been net sellers since October, with cumulative flows since launch peaking in late October at 62,700 BTC and sits currently at 54,300 BTC, with some sporadic inflows, but an overall trend of consistent outflows across all providers, showing decreasing appetite for crypto exposure from the ETF cohort.
In recent days however, selling pressure from ETFs has begun to abate.
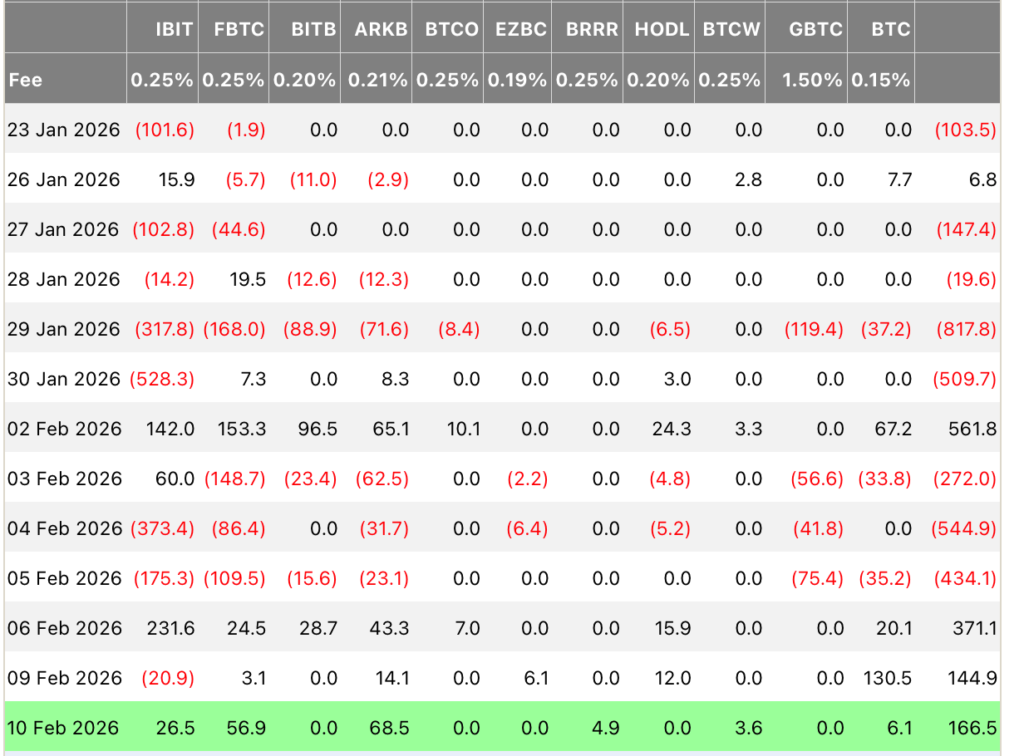
Spot Bitcoin ETFs attracted $371M on Friday, followed by $145M on Monday. This brings total inflows over the two days to $516M. The streak snaps a month-long redemption period that began in mid-January. If ETF flows and consistent aggressive selling pressure stabilises, we expect the price to stabilise too and form an accumulative range between key on-chain levels discussed below.
Forward Guidance And Key Levels To Watch
Long-term holder supply is finally moving higher, signalling early signs of accumulation.
Previously this metric continued to fall as whales and long-term holders, often overlapping cohorts of investors, distributed their holdings moving 13.5% lower between July-December 2025. Currently the metric has moved to 14.3 million BTC after bottoming in mid December.
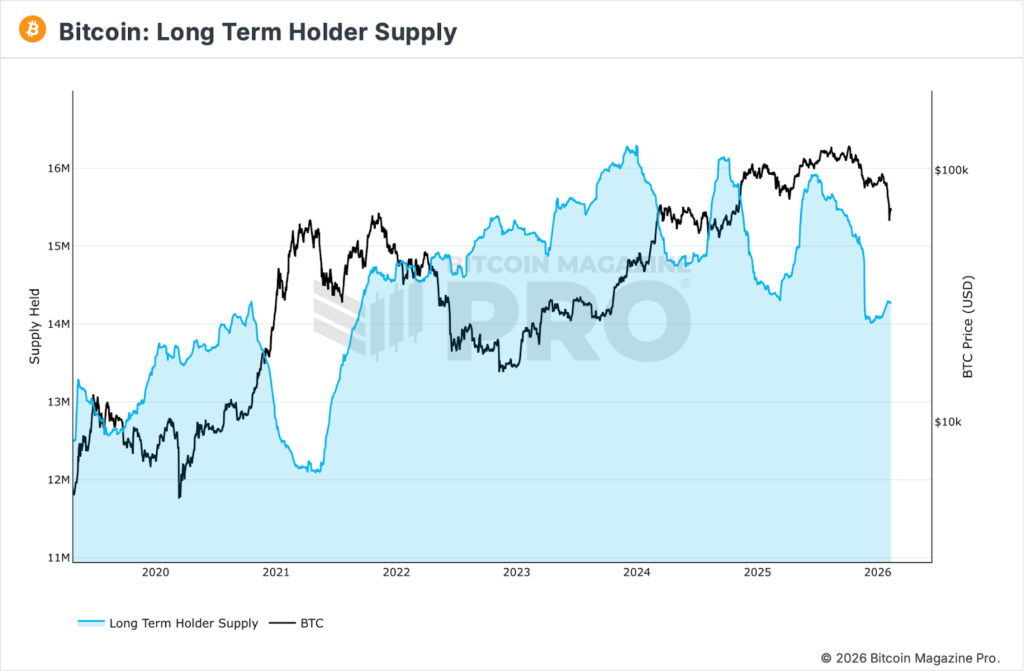
Typically, LTH supply is a leading metric to price, as accumulation starts during the latter end of downtrends. In recent history, this metric reaching new highs has proved to be a 3-4 month leading indicator in relation to price.
If this continues to increase at the current pace, we might see a repeat of June 2023 or September 2024-like price action once our current range resolves towards the upside.
From a mid-term valuation standpoint, Bitcoin is becoming increasingly boxed within a well-defined structural corridor.
On the upside, the True Market Mean (~$78.2k) has flipped into overhead resistance following repeated failures to reclaim it on both daily and weekly timeframes. This level previously acted as a demand anchor during consolidation phases, but after the breakdown, it now represents a zone where prior support may transition into supply.
On the downside, the Realised Price (~$55k) continues to define the deeper value boundary of the current cycle. Historically, this metric which reflects the aggregate cost basis of the network has served as the level where long-term capital meaningfully re-engages during extended corrective phases. Moves toward the Realised Price typically coincide with late-stage deleveraging, capitulation among weaker cohorts, and the gradual re-accumulation by stronger hands.
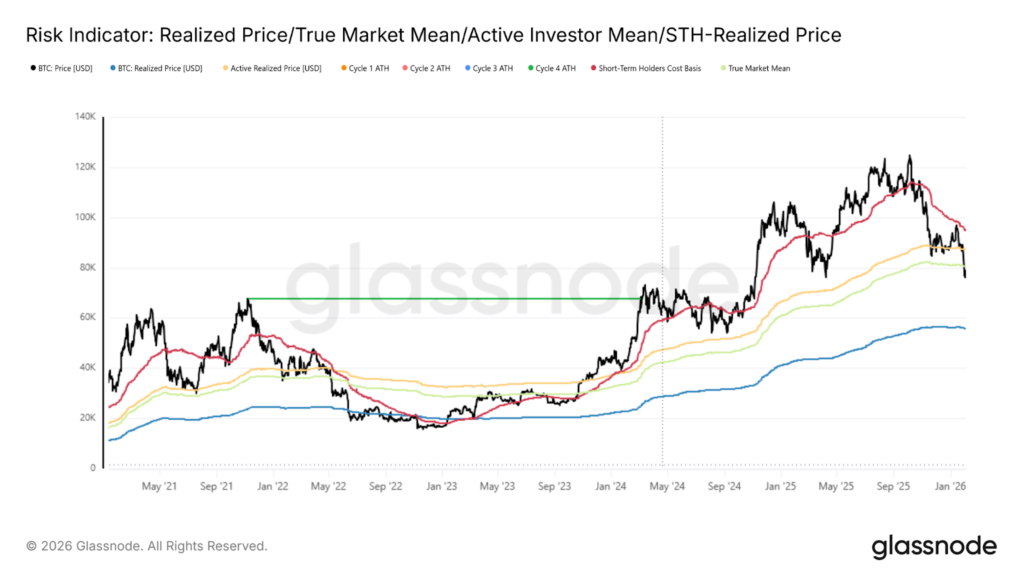
As long as price remains trapped between these two structural anchors, the market is likely to oscillate within a wide but definable valuation band, with upside attempts capped near cost-basis resistance and deeper downside attracting longer-horizon buyers.
From a derivatives standpoint, we believe spot market dynamics are far more important currently as perpetual market open interest is down from an ATH of $92.4 billion to $44,7 billion. Funding rates are largely neutral or negative for major crypto assets and as a result, the liquidations that occurred on February 5, which was the largest one-day decline in over 3 years (-14.04 percent), caused a relatively muted amount of liquidations.
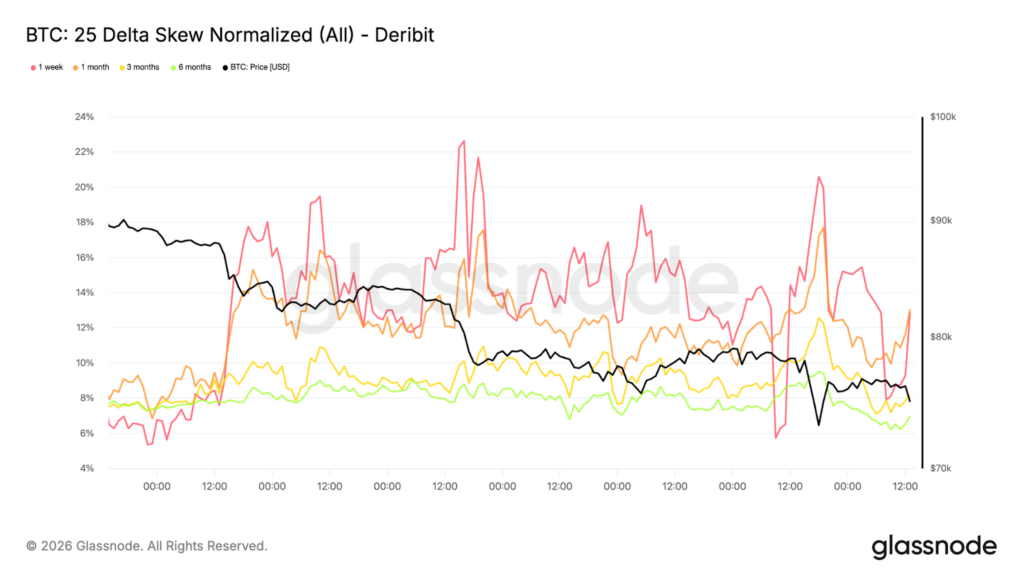
Options positioning continues to reinforce the market’s defensive posture. Downside skew has steepened once again, reflecting a renewed bid for protective puts relative to calls. Even with price holding above the $73k region, participants are prioritising hedging against further gap risk rather than positioning for a meaningful relief rally.
Flow dynamics confirm this bias. Instead of rotating into upside exposure, options activity remains concentrated in downside protection structures. This keeps the implied probability distribution skewed toward negative outcomes and aligns with the persistent firmness in front-end volatility.
A pronounced downside skew is not merely a volatility feature; it is a signal of behavioural preference. Traders are demonstrating a willingness to pay elevated premiums for insurance rather than express directional optimism. Until call demand begins to build and skew normalises, positioning remains asymmetrically defensive, with risk perceived to lie predominantly to the downside rather than in a sustained recovery scenario.
The post appeared first on Bitfinex blog.