0%
Polkadot (DOT) Falls to Lowest Weekly Close Since 2020
#support and resistance#bearish#Technical Analysis 101+1 more tags

Polkadot (DOT) Falls to Lowest Weekly Close Since 2020

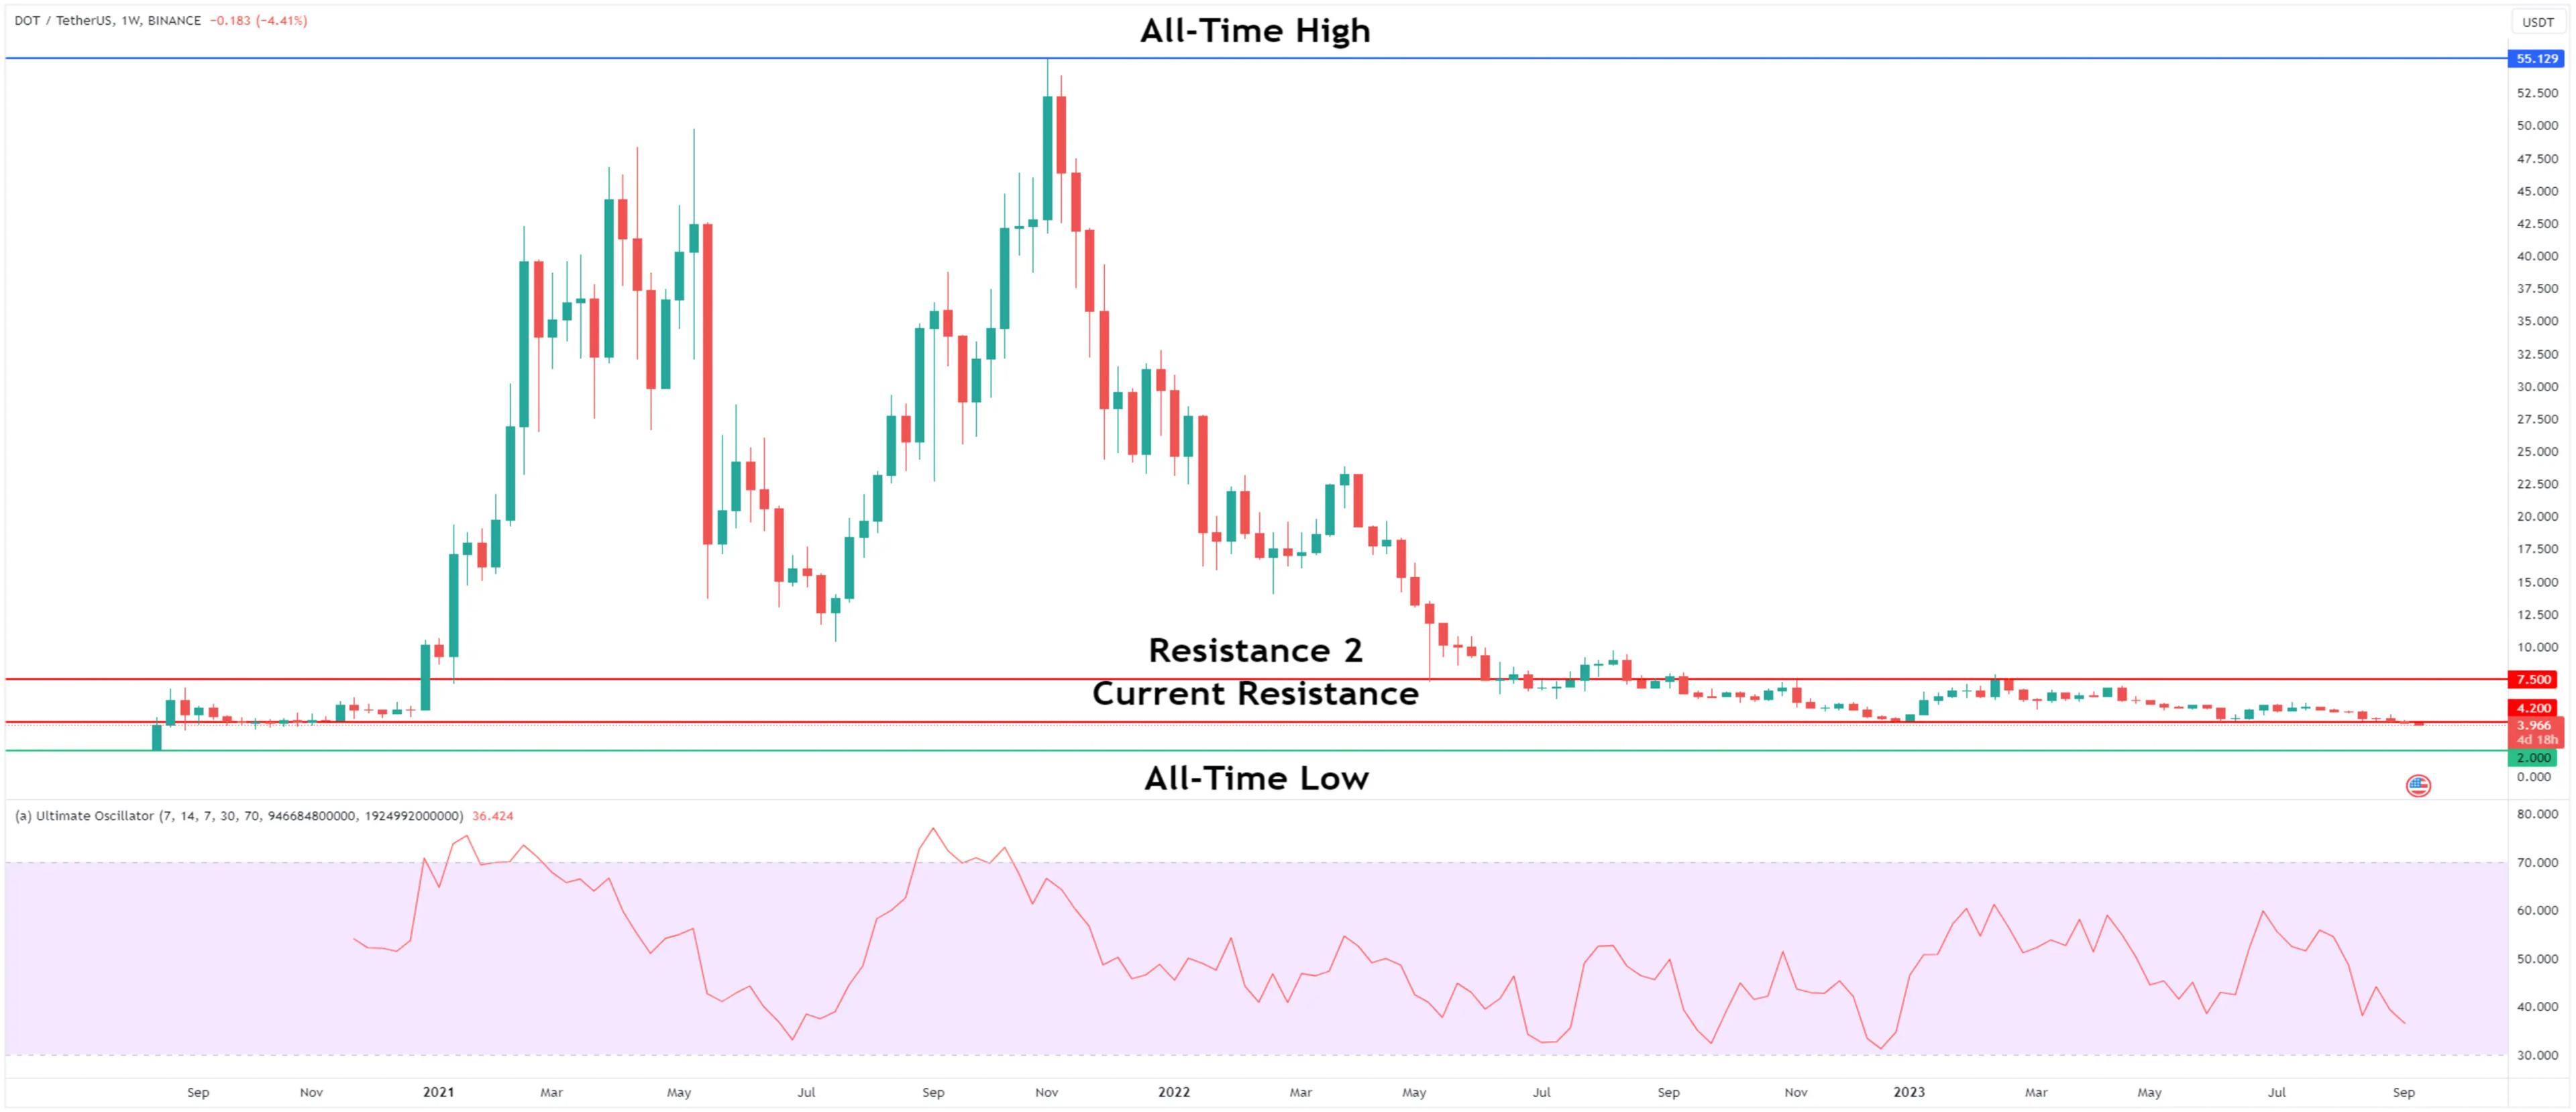
Polkadot (DOT) recently experienced a significant breakdown as it fell below the crucial $4.20 support level, marking its lowest weekly close since 2020. This decline has raised concerns among investors and analysts alike.

DOT has been following a bearish trajectory since reaching its yearly high of $7.90 in February 2023. It slid below the $4.20 support level, which had held since the beginning of the year. Such breakdowns from long-standing support levels often trigger substantial declines.

Chart by TradingView

The conjunction of this support area and a descending resistance line has formed a descending triangle, a bearish pattern that underscores the breakdown and hints at the possibility of further losses.

Potential scenarios

If the downtrend persists, DOT's price could potentially drop by another 50%, reaching the $2 horizontal support area, aligning with its all-time lows from August 2020.

However, if DOT manages to reclaim the $4.20 area and break free from the descending resistance line, it could trigger an impressive 85% price surge toward the $7.50 resistance area.

The weekly Ultimate Oscillator, a momentum indicator used to determine overbought or oversold conditions, supports the prevailing downtrend, with readings below 50 and a declining trend considered bearish signals.

Bottom Line: Despite the bearish predictions for DOT, a potential breakout from the channel and the $4.40 area could pave the way for an 85% surge toward the $7.50 resistance region.

Inbox Image

Newsletter

Get the weekly email with exclusive crypto analyses and news worth reading. Stay informed and entertained, for free.

Related Articles

Bot Trading 101 | How To Apply a Scalping Strategy
#Automated trading strategy#Strategy designer#EMA+3 more tags

Bot Trading 101 | How To Apply a Scalping Strategy

Cryptocurrencies | BTC vs. USDT As Quote Currency
#Bitcoin#crypto trading#crypto trading tips+2 more tags

Cryptocurrencies | BTC vs. USDT As Quote Currency

Technical Analysis 101 | What Are the 4 Types of Indicators?

Technical Analysis 101 | What Are the 4 Types of Indicators?

Bot Trading 101 | The 9 Best Trading Bot Tips of 2023
#crypto trading#trading bot#crypto trading tips+2 more tags

Bot Trading 101 | The 9 Best Trading Bot Tips of 2023

Start trading with Cryptohopper for free!

Free to use - no credit card required

Let's get started
Cryptohopper appCryptohopper app

Disclaimer: Cryptohopper is not a regulated entity. Cryptocurrency bot trading involves substantial risks, and past performance is not indicative of future results. The profits shown in product screenshots are for illustrative purposes and may be exaggerated. Only engage in bot trading if you possess sufficient knowledge or seek guidance from a qualified financial advisor. Under no circumstances shall Cryptohopper accept any liability to any person or entity for (a) any loss or damage, in whole or in part, caused by, arising out of, or in connection with transactions involving our software or (b) any direct, indirect, special, consequential, or incidental damages. Please note that the content available on the Cryptohopper social trading platform is generated by members of the Cryptohopper community and does not constitute advice or recommendations from Cryptohopper or on its behalf. Profits shown on the Markteplace are not indicative of future results. By using Cryptohopper's services, you acknowledge and accept the inherent risks involved in cryptocurrency trading and agree to hold Cryptohopper harmless from any liabilities or losses incurred. It is essential to review and understand our Terms of Service and Risk Disclosure Policy before using our software or engaging in any trading activities. Please consult legal and financial professionals for personalized advice based on your specific circumstances.

©2017 - 2024 Copyright by Cryptohopper™ - All rights reserved.