.webp&w=1920&q=75)
Trading STEPN (GMT) has become increasingly popular, and with the growth of this market, traders are always looking for new strategies to maximize their profits. One such strategy that can work on STEPN is the Stochastic RSI With Region Crossovers. This analysis will explain what GMT and Stochastic RSI are and how to trade it using this strategy.
What is STEPN GMT? STEPN GMT is a cryptocurrency that was launched in 2019.
It is a decentralized digital asset that is built on the Ethereum blockchain. The project aims to provide users with a fast, secure, and reliable payment system that can be used globally.
STEPN GMT has a current market capitalization of over $70 million, and it is traded on various crypto exchanges.
What is the Stochastic RSI? The Stochastic RSI is a technical indicator that is used to measure the momentum of a particular asset.
It is calculated by taking the RSI (Relative Strength Index) and applying the stochastic oscillator formula to it. The Stochastic RSI ranges between 0 and 100, with readings above 80 indicating overbought conditions and readings below 20 indicating oversold conditions.
How easy is the Stochastic RSI to use? The main use of the Stochastic RSI is to help identify possible turning points in the market. When the market is overbought, it is ripe for a correction or reversal. Similarly, when the market is oversold, it may be due for a bounce.
The Stochastic RSI can also be used to confirm other technical signals. For example, if you see a bearish divergence (where price makes new highs but the Stochastic RSI does not), this could be an early warning sign that price may soon begin to fall.
Overall, the Stochastic RSI is a useful tool for finding potential reversals in the market. While it cannot predict future price movements with 100% accuracy, it can help give you an edge in your trading.
Trading STEPN GMT with the Stochastic RSI With Region Crossovers
At Cryptohopper, we use the Stochastic RSI With Region Crossovers to trade STEPN GMT by buying when the indicator comes back from oversold and selling when it comes out of overbought. For example, if GMT is dropping and the Stochastic RSI dips below 20, traders will buy when the Stochastic RSI crosses back above 20. Conversely, if GMT is increasing and the Stochastic RSI crosses above 80, traders will only sell when it comes back down below 80. We said "Stochastic RSI" specifically because we make an average out of the K and D line.
Cryptohopper has backtested multiple settings to find the best ones for trading STEPN GMT with the Stochastic RSI With Region Crossovers.
In these backtests, we assumed a 0.1% fee per trade, no slippage, and all trades were taken with the entire amount. The best settings we found were:
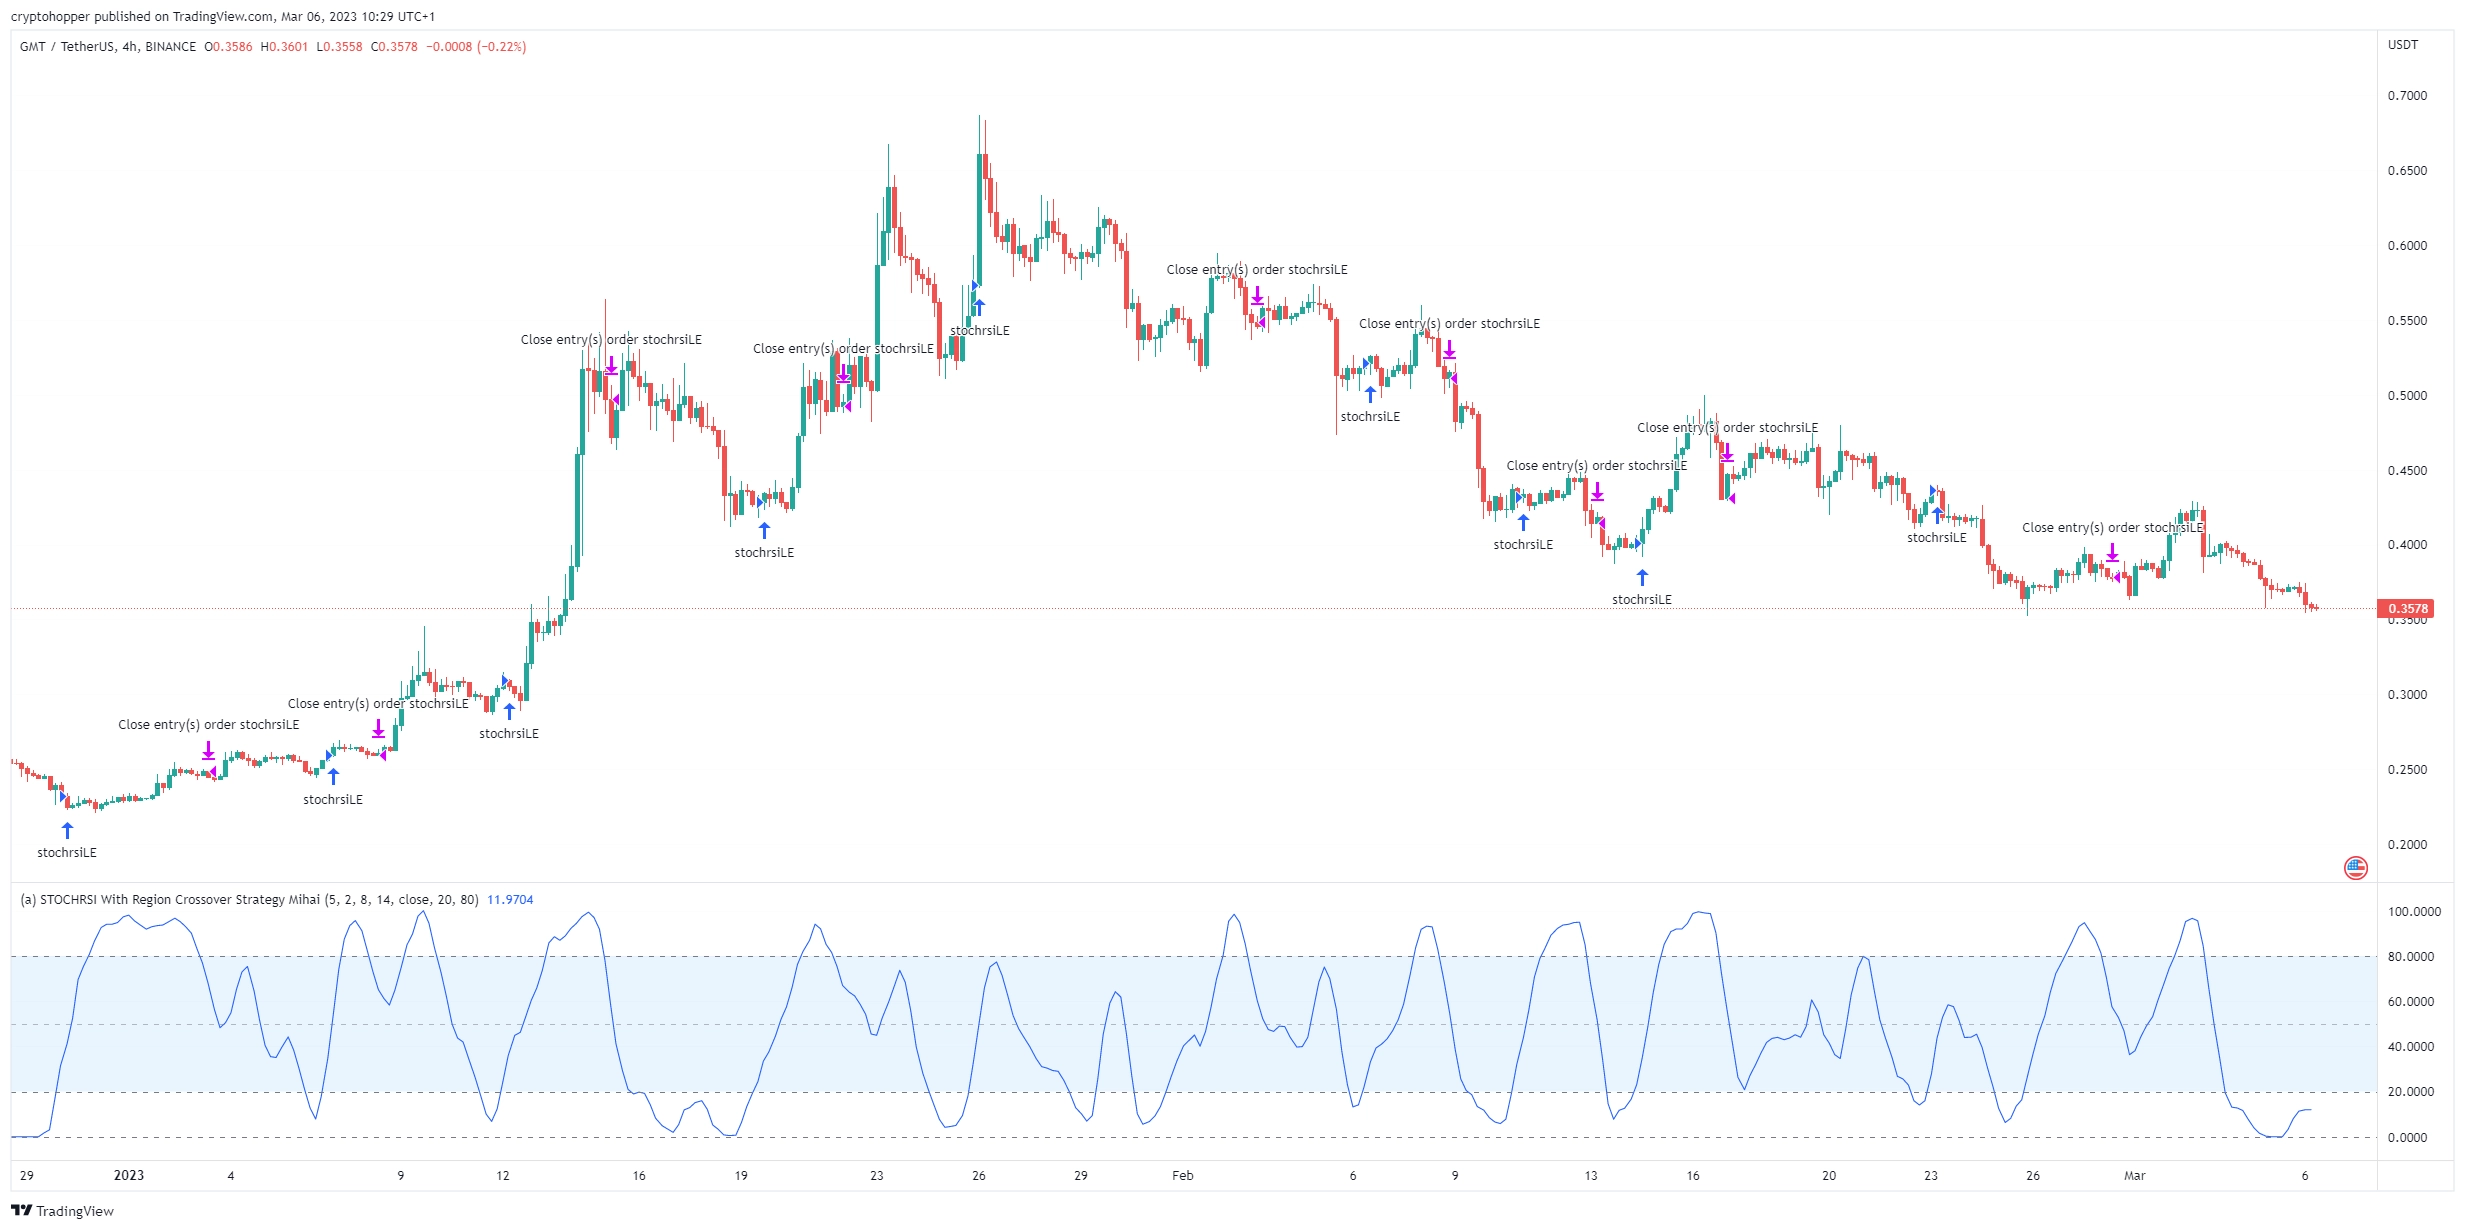
- Chart Period 4H
- RSI Period 8
- FASTK_Period 5
- FASTD_Period 2
These settings resulted in a profit of 1,976% with a drawdown of 58%, which is significantly better than the buy and hold profit of 240% and drawdown of 95%.
Disclaimer: It is important to note that past performance does not guarantee future results, and traders should always do their own research before making any trades. While we used Tradingview to make this chart, please do not make this strategy on Tradingview as the results will be very different.
That is because at Cryptohopper, we calculate indicators using the TAlib library, while Tradingview calculates them on their own. This makes some indicators have different values, which includes the stochastic RSI.


_webp.webp&w=1920&q=75)
_webp.webp&w=1920&q=75)