0%
Bitcoin Performs Breakout!
#BTC#Bull market#support and resistance+2 more tags

Bitcoin Performs Breakout!

Bitcoin surges past $40,000, eyeing $48,000. Key supports at $40,000, $32,000, with the 200 SMA indicating market trends.

On Monday, December 4th, Bitcoin (BTC) made a remarkable move, surging beyond the $40,000 mark and registering a substantial 5% gain within a single day. The burning question now is whether this upward momentum will persist and, if so, for how long? Conversely, could the market encounter a downturn, and if it does, what might be the potential extent of the decline? Let's delve into the details to uncover the possibilities!

Bitcoin Performs Breakout Chart

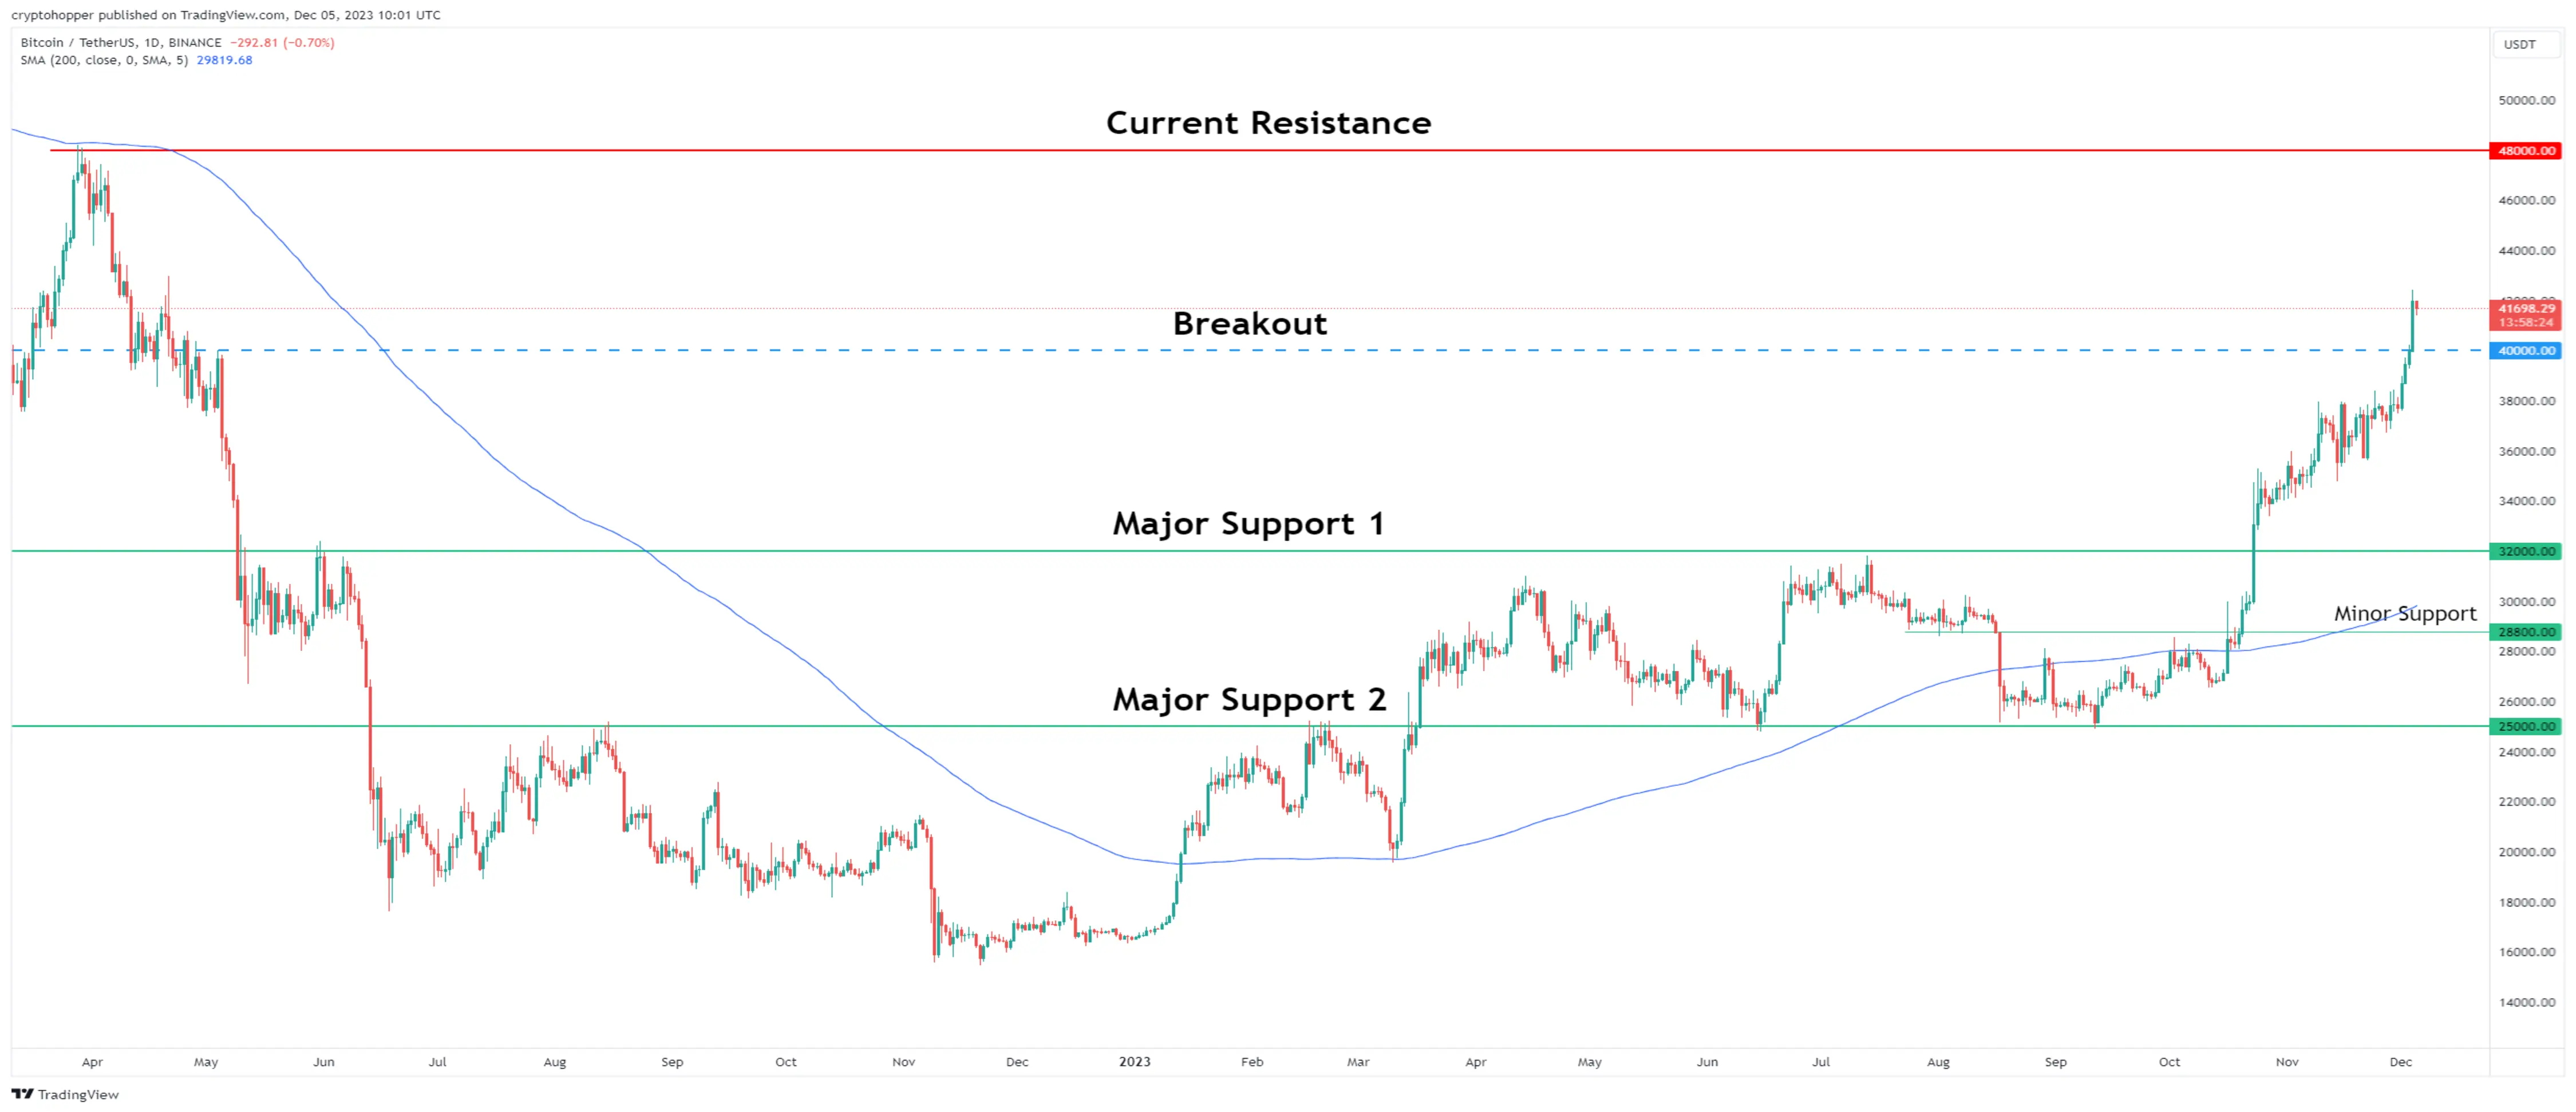
Chart by TradingView

Should Bitcoin maintain its current upward trajectory, its sights may be set on the next significant resistance level, approximately $48,000. This level represents an ascent of more than 15% from the present price point. Furthermore, if the price successfully breaches this threshold, it would bring the coveted All-Time High of $69,000 within reach, serving as the subsequent resistance to conquer.

Considering the Downside

Conversely, in the event that BTC loses its bullish momentum and undergoes a corrective phase, there's a pivotal support at $40,000. Should this level falter to uphold its support role, the $32,000 level stands as the subsequent critical support zone to watch.

Adding to this, the daily 200 Simple Moving Average (SMA) assumes a mobile support role in this price journey. When BTC maintains a position above the 200 SMA, this moving average functions as a supportive foundation. Conversely, when the price descends below it, the 200 SMA transforms into a formidable resistance.

Historically, breaking above the 200 SMA has signified a tendency for the price to sustain such a position for a protracted period. Notably, during the 2020 bull run, the price remained above the 200 SMA for longer than a year.

Bottom Line: Bitcoin's recent breakout above $40,000 is generating optimism. It may target $48,000 and even approach the All-Time high of $69,000 if the uptrend persists. On the downside, $40,000 and $32,000 serve as key support levels. The daily 200 SMA, a critical indicator, could signal an extended bullish trend akin to the 2020 bull run.

Inbox Image

Newsletter

Get the weekly email with exclusive crypto analyses and news worth reading. Stay informed and entertained, for free.

Related Articles

Bot Trading 101 | How To Apply a Scalping Strategy
#Automated trading strategy#Strategy designer#EMA+3 more tags

Bot Trading 101 | How To Apply a Scalping Strategy

Cryptocurrencies | BTC vs. USDT As Quote Currency
#Bitcoin#crypto trading#crypto trading tips+2 more tags

Cryptocurrencies | BTC vs. USDT As Quote Currency

Technical Analysis 101 | What Are the 4 Types of Indicators?

Technical Analysis 101 | What Are the 4 Types of Indicators?

Bot Trading 101 | The 9 Best Trading Bot Tips of 2023
#crypto trading#trading bot#crypto trading tips+2 more tags

Bot Trading 101 | The 9 Best Trading Bot Tips of 2023

Start trading with Cryptohopper for free!

Free to use - no credit card required

Let's get started
Cryptohopper appCryptohopper app

Disclaimer: Cryptohopper is not a regulated entity. Cryptocurrency bot trading involves substantial risks, and past performance is not indicative of future results. The profits shown in product screenshots are for illustrative purposes and may be exaggerated. Only engage in bot trading if you possess sufficient knowledge or seek guidance from a qualified financial advisor. Under no circumstances shall Cryptohopper accept any liability to any person or entity for (a) any loss or damage, in whole or in part, caused by, arising out of, or in connection with transactions involving our software or (b) any direct, indirect, special, consequential, or incidental damages. Please note that the content available on the Cryptohopper social trading platform is generated by members of the Cryptohopper community and does not constitute advice or recommendations from Cryptohopper or on its behalf. Profits shown on the Markteplace are not indicative of future results. By using Cryptohopper's services, you acknowledge and accept the inherent risks involved in cryptocurrency trading and agree to hold Cryptohopper harmless from any liabilities or losses incurred. It is essential to review and understand our Terms of Service and Risk Disclosure Policy before using our software or engaging in any trading activities. Please consult legal and financial professionals for personalized advice based on your specific circumstances.

©2017 - 2024 Copyright by Cryptohopper™ - All rights reserved.