
Combine These 2 Indicators if You Want to Trade Crypto Breakouts
Identifying when the market switches from consolidation into trending mode can make the difference between winning and losing. In hindsight, the breakout from a consolidation pattern might be obvious, but identifying this in real-time can be a real challenge for all traders.
Bollinger Bands and Keltner Channels
The good news is that there are two technical indicators that, when used together, can help trade breakouts like the pros.
Combined, the Bollinger Bands and Keltner Channels can help us identify when there is a switch from consolidation to trend mode.
When the price of a crypto asset is consolidating inside a tight range, it tends to have a strong breakout. The Bollinger Bands and Keltner Channels come into play nicely because we can visualize when momentum changes and a breakout is likely to follow.
What are Bollinger Bands?
Bollinger Bands are a technical indicator that is used to measure market volatility.
The indicator is made up of three lines: the upper Bollinger Band, the lower Bollinger Band, and the middle Bollinger Band. The upper and lower Bollinger Bands are set 2 standard deviations above and below the middle Bollinger Band. The middle Bollinger Band is a simple moving average.
When the markets are volatile, the Bollinger Bands will expand. When the markets are not volatile, the Bollinger Bands will contract.
Learn more on Identifying the Trend and Making a Profit with Bollinger Bands here.

What are Keltner Channels?
Keltner Channels are a technical analysis tool used by traders to identify breakout opportunities in the market.
The indicator is made up of three lines: the upper line, lower line, and middle line. The upper and lower lines are placed at a certain distance from the middle line, and this distance is determined by the volatility of the market. When the price breaks out above or below the upper or lower line, it is an indication that a breakout is happening.
How to Trade Breakouts
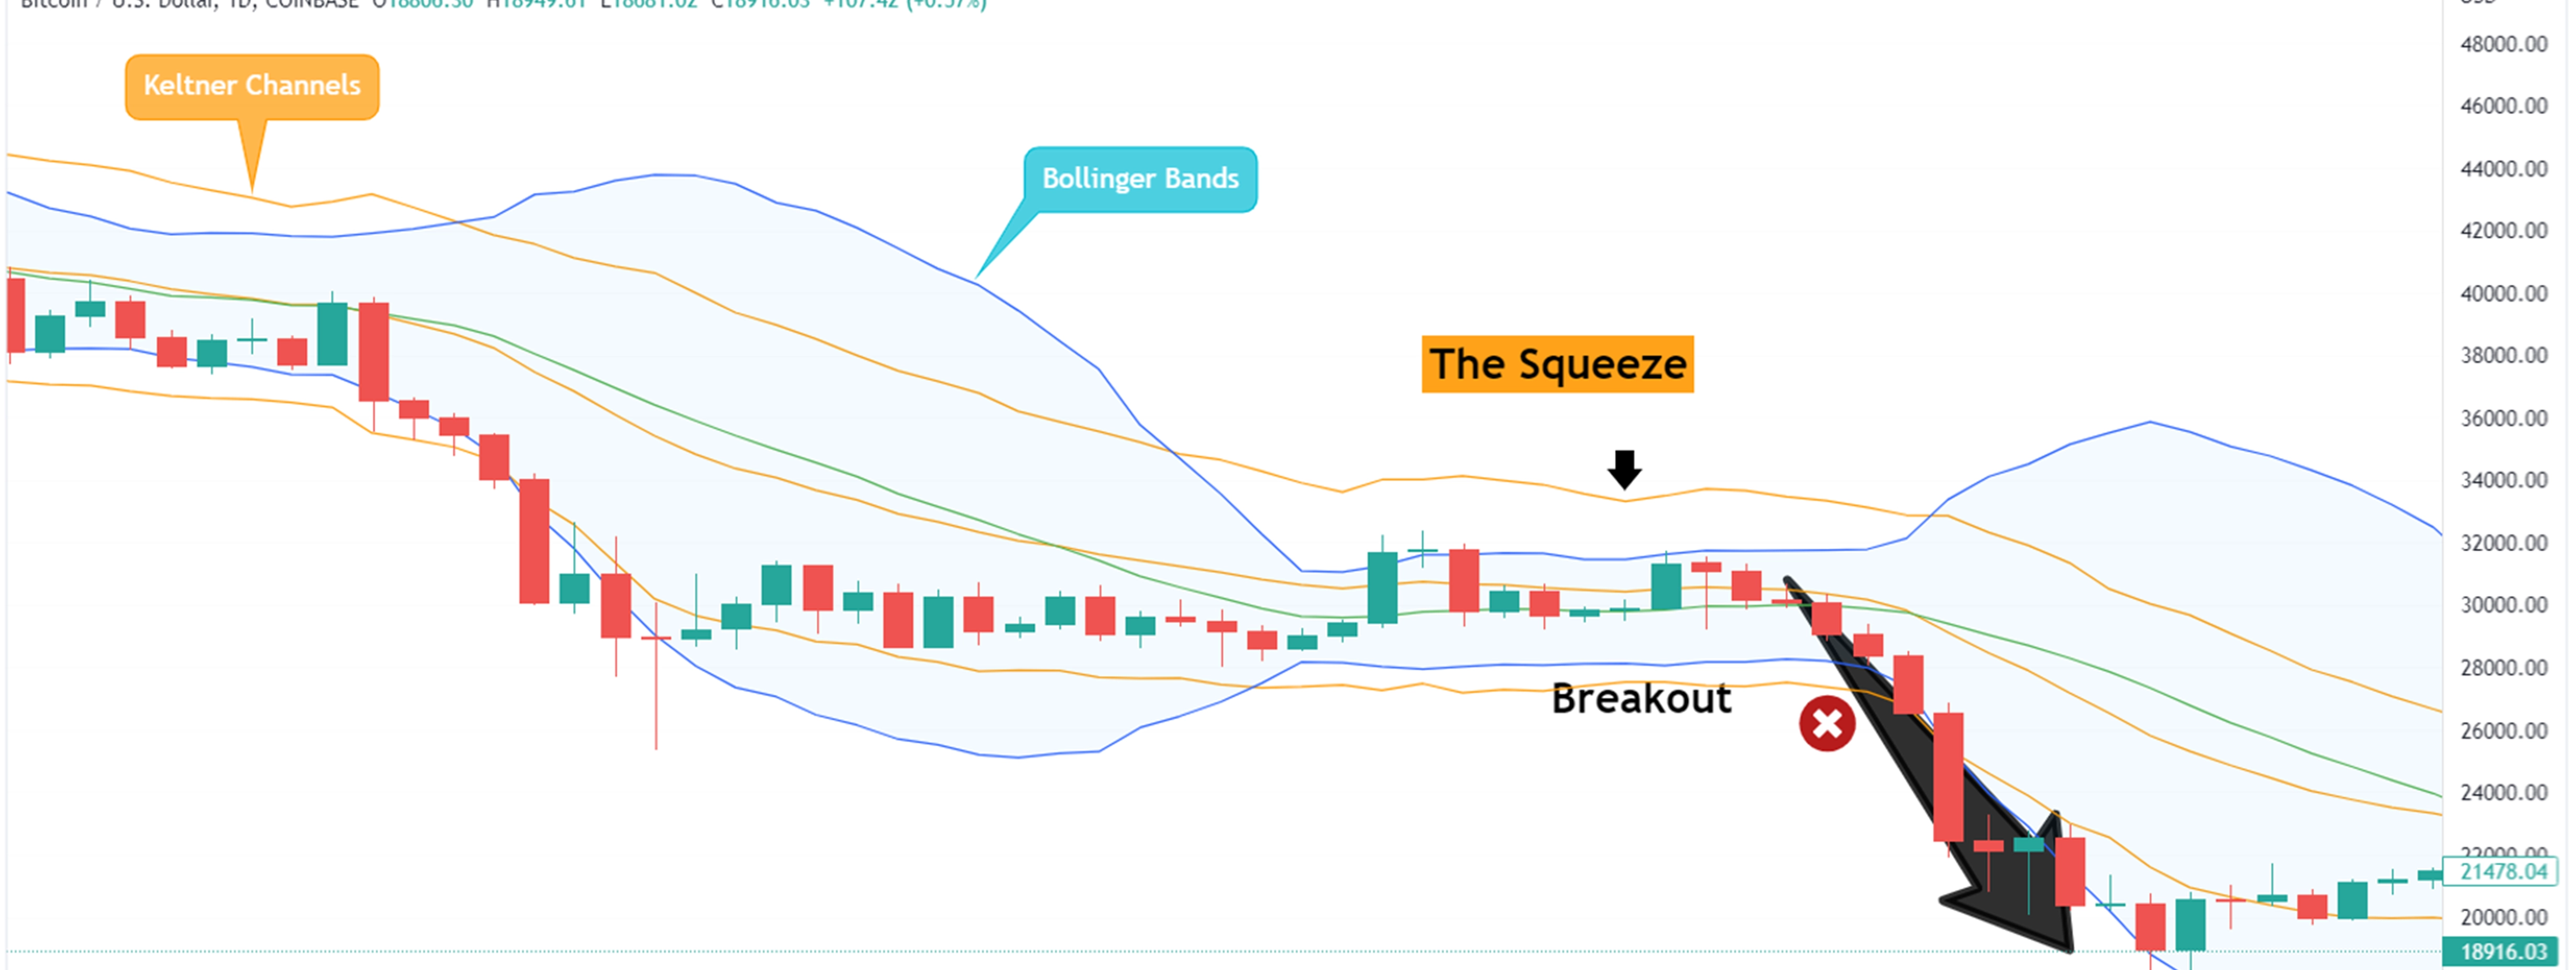
When both the upper and lower bands of the Bollinger Bands indicator go inside the Keltner Channel bands, it signals a period of consolidation. This pattern is known as the “squeeze.”
Conversely, when the Bollinger Bands expand and move beyond the Keltner Channels, we have a shift in momentum, and the prices are likely to break out of that consolidation in one direction or the other.
Combining Bollinger Bands and Keltner Channels takes a lot of the guesswork out of trading.
Bottom line
If you want to trade cryptocurrency breakouts, combining Bollinger Bands and Keltner Channels is a great way to do it.
Bollinger Bands help you identify potential breakout points, while Keltner Channels can help you confirm whether or not a breakout is actually happening. By using both indicators together, you can get a better picture of what's going on in the market and make better-informed trading decisions.


_webp.webp&w=3840&q=75)
_webp.webp&w=3840&q=75)


