
Uncover the essentials of the Crypto Fear and Greed Index to gauge market sentiment. Dive deep into its components and impact on cryptocurrency trading.
As an investor, it's essential to seek out relevant data to make informed decisions when trading cryptocurrencies. To gauge market sentiments accurately, you can explore various market indicators and indexes.
The crypto fear and greed index offers insights into market sentiments and fundamental metrics. While it shouldn't be your sole tool for market analysis, it can be a valuable part of your trading strategies.
Monitoring changes in the fear and greed index can aid in your decisions on when to enter or exit the cryptocurrency market.
It's important to note that the crypto fear and greed index is a weighted measure of market data based on various indicators. It's not something you can buy or a financial instrument.
Instead, it serves as a supplementary market indicator to enhance your analysis. In the world of cryptocurrencies, research often involves analyzing social media, community sentiment, and public opinion.
Therefore, sentiment analysis provided by the fear and greed index can be valuable for this asset class.
What is the Crypto Greed and Fear Index?
The fear and greed index was originally developed by CNNMoney to assess market sentiments for stocks and shares.
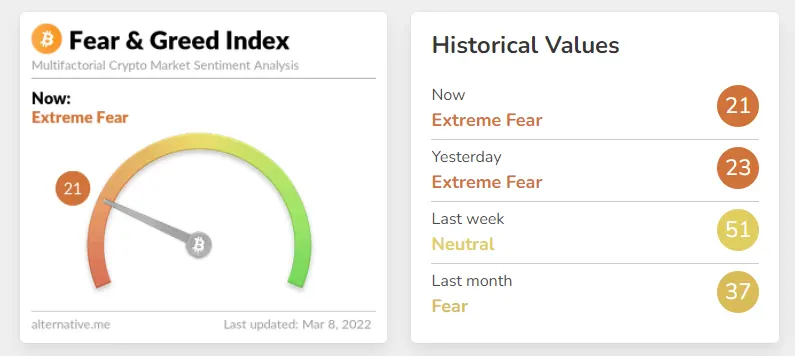
However, Alternative.me has created a version of the fear and greed index specifically tailored to the crypto market. This customized index can provide insights into cryptocurrency market sentiments.
The crypto fear and greed index assesses various trends and market indicators to determine whether market participants are currently feeling fearful or greedy. It assigns a score ranging from 0 to 100 to represent the overall sentiment in the crypto market.
A score of '0' suggests that the market is in a state of extreme fear, while a score of '100' indicates extreme greed. When the score is 50, it signifies a neutral market sentiment.
When the score is between 0 to 49, the market is said to be fearful. This could be an indication that the cryptocurrencies are undervalued and there is excessive supply in the market. Extreme fear can lead to overselling and panic.
This could mean that the market has entered into a long-term bearish trend. This can be considered as a short or mid-term reference to overall crypto market sentiment.
When the crypto fear and greed index falls within the range of 50 to 100, it signifies a market that is characterized by greed.
In this scenario, there's a likelihood that cryptocurrencies are being overvalued, which can potentially lead to the formation of a bubble. During times of market greed, investors may push cryptocurrency prices higher by overestimating their value.
This excessive greed can result in heightened demand, causing prices to become inflated. Therefore it's important that you proceed with caution when the market sentiment is in this range, as it can indicate a potential risk of overvaluation and a subsequent market correction.
How to Measure Crypto Greed and Fear index?
Alternative.me calculates a daily score ranging from 0 to 100 specifically for Bitcoin on the crypto fear and greed index.
Currently, the analysis is focused solely on Bitcoin-related data due to its strong correlation with the overall cryptocurrency market in terms of both price and sentiment.
However, other websites have also expanded the coverage to other cryptocurrencies such as Ethereum (ETH) and Binance Coin (BNB). The index's scale is divided into categories as follows:
- 0-24: Extreme fear
- 25-49: Fear
- 50-74: Greed
- 75-100: Extreme greed
The crypto fear and greed index is determined by considering five distinct market factors, each with its own level of importance in the calculation. Let's take a closer look at these five weighted market factors.
Volatility
Volatility is a significant market factor, making up 25% of the index. It assesses Bitcoin's present value by averaging its recent values over the past 30 and 90 days. This factor serves as an indicator of market uncertainty.
Market Volume/Momentum
The current trading volume and market momentum of Bitcoin are compared to the 30- and 90-day average values and then combined. Market volume accounts for 25% of the fear and greed index.
A consistent high-volume buying trend indicates a positive or greedy market sentiment.
Social Media
Social media results are also used to measure the fear and greed index. This market factor takes into account Twitter hashtags related to Bitcoin and the interaction rate.
Social media contributes to 15% of the fear and greed index. Consistently high interactions related to the market indicate more greed than fear.
Bitcoin Dominance
This market factor measures Bitcoin's dominance. If Bitcoin's dominance increases, it suggests the possibility of new investments and reallocation of funds from altcoins. Bitcoin dominance makes up 10% of the overall crypto fear and greed index.
Google Trends
Google trends data for Bitcoin-related search queries provides insights into the market’s emotional behaviour. For instance, if the number of searches for ‘Bitcoin scam’ increases, then it would indicate market fear. The Google trends market factor has 10% of the index.
In addition to these five market factors, survey results are also considered, although surveys are currently paused. Typically, survey results contribute to the overall index score by 15%.
Greed and Fear Index for Long-Term Analysis
The crypto fear and greed index is more useful for swing traders and short-term analysis. It may not be as effective for long-term predictions, as it focuses on identifying cycles of fear and greed within the market rather than long-term trends. Keep in mind that it may not accurately predict shifts from bull to bear markets.
Bottom Line
When it comes to making informed investment decisions, it's essential to consider multiple market aspects and avoid relying solely on a single indicator or analysis style for a long-term perspective.
Conducting your research and staying well-informed will empower you to make wiser investment choices.
The crypto greed and fear index provides a simple way to gauge fundamental market sentiment metrics. To gain a more comprehensive understanding of the market, it's a good practice to complement the fear and greed index with various other metrics and indicators.
This well-rounded approach will help you make more informed decisions in the crypto market.


_webp.webp&w=1920&q=75)
_webp.webp&w=1920&q=75)