
Technical Analysis 101 | How To Combine Trading Indicator Combination
Designing your trading strategy based on MACD combinations.
A well functioning strategy can be compared to a Negroni. The popular Italian cocktail is made of 3 liquors: Gin, Campari and Martini Rosso.
Poured on their own in an old fashion glass, these three liquors would make even the most seasoned bartender gag. But put them together, and they counteract each other's negatives. What you're left with is a deadly but delicious summer cocktail that will turn every picnic into a party.
Great traders combine technical indicators in the same way. They understand that the shortcomings of one may actually be fixed by another, and vice versa.
This blog will highlight some strategies that are made up of combined technical indicators and which, when read together, do not clutter up your charts. Yet, consulting more than one indicator at the same time is very important. In fact, few traders use just one indicator to conduct their strategies.
A combination will strengthen a traders conviction. Multiple indicators giving the same type of signal (buy or sell signal) will help them decide with more certainty whether the position should be opened or not. In this way, the chances of a trade being positive are higher, and false signals are filtered out.
Like all things in trading, however, this relationship is not always beneficial. Too many indicators combined can have negative effects on your trading. This can be very restrictive and demanding for your trading, leading to very few trades or even negative trades.
Rather than highlighting all the possible combinations that exist, we’ll go over how you can combine a handful of indicators with the world-renowned indicator: Moving Average Convergence Divergence (MACD)
MACD combinations
MACD is one of the most popular indicators and it can be used along with other ones to identify trading opportunities. It is frequently used with Relative Strength Index(RSI), the stochastic and supports and resistances. Here are some examples of how you might be able to combine them with another indicator.
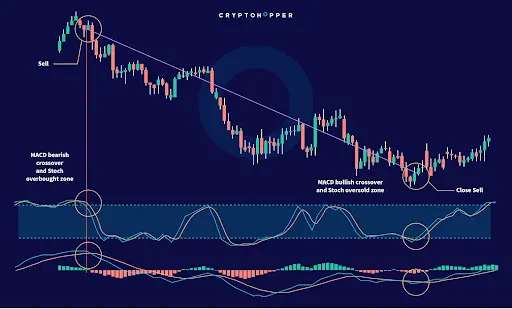
MACD and Stochastic
The Stochastic indicator mainly measures when a certain stock is overbought or oversold and MACD is a trend following indicator that shows the relationship between a 26 and 12 days EMA from where the MACD and the signal line are obtained.
The Stochastic sets a range from 0 to 100 in which levels lower than 20 can be identified as oversold, and higher than 80 overbought. On the other hand, MACD gives buy and sell signals through its signal and MACD lines crossovers.
A buy signal takes place when the MACD line rises above the signal line and a sell signal occurs when the MACD line goes below the signal line. You can combine them in the following way:
MACD gives a buy/sell signal through a crossover of both of its lines.
Stochastic levels rise above 80 (overbought → sell signal) or below 20 (oversold → buy signal).
Both indicators give the same type of signal (buy or sell).
Open a position.
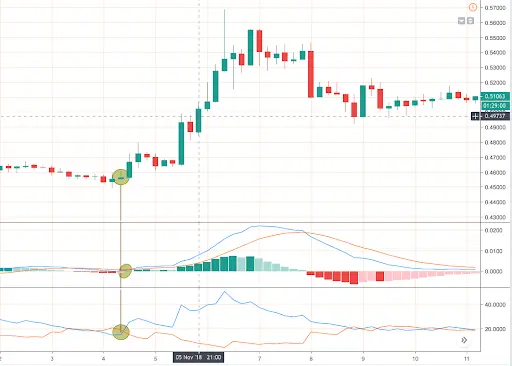
MACD and RSI
The Relative Strength Index is also a momentum indicator that measures recent price changes in order to determine if the current price is oversold or overbought.
It sets a range from 0 to 100 and assigns values for the oversold and overbought areas. In the case of the RSI, these ones are 70 and 30 respectively. They work in a very similar way to the previous case:
MACD gives a buy/sell signal through a crossover of both of its lines.
RSI levels rise above 70 (overbought) or below 30 (oversold).
Both indicators give the same type of signal.
Open the position
MACD and DMI
Directional Movement Index (DMI) is a momentum indicator compound by 2 lines: a negative directional index (-DI) and a positive directional index (+DI). The DMI measures the strength of the positive and negative trends.
DMI gives buy and sell signals through +DI and -DI crossovers. When +DI crosses upwards -DI, it suggests that the price is increasing and, therefore, gives a Buy signal. However, when -DI crosses downwards +DI, it gives a Sell signal.
A strategy that combines both indicators would work in the following way:
MACD gives a buy/sell signal through a crossover of both of its lines.
DMI gives a buy/sell signal through a DMI crossover.
Both signals are given at the same time or during the “Keep signal for x candles” time
Open the position.
Conclusion
The above mix of indicators can be applied to different time frames and candle sizes. From scalping to position trading.
It’s important to note, however, that asset don't always behave in the same way. For this reason, before implementing any strategy made up of a combination of indicators, it is strongly advised to backtest it for a few months in order to check if it can be profitable for a specific asset, as well as which time frames are more suitable to trade with.
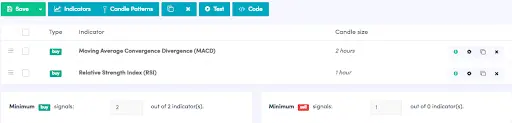
In the Cryptohopper platform, you can easily choose several combinations of indicators. You just have to follow these 3 steps:
Select the indicators you would like to combine and which of them will be necessary to open a trade.
Choose its key levels, such as the number of periods for a moving average or DMI
Let the bot implement your strategy and work for you.
Start trading on Cryptohopper now


_webp.webp&w=3840&q=75)
_webp.webp&w=3840&q=75)


