Charts are crucial in crypto trading as it contains lots of valuable information about the market. We’ve also learned that understanding chart patterns is essential for traders to decide the best action they need to take in response to the market situation.
In this chart pattern series, we will learn about the Wedge chart pattern.
The Wedge formation may appear similar to the symmetrical triangle pattern at a glance. However, it has a key distinguisher, which is a noticeable slant either downward or upward.
A wedge pattern is formed by two converging straight lines. The two straight lines are the support and resistance that move in the direction of the market price. If you are not familiar with support and resistance, you can learn about them here.
Depending on the direction of the price movement, there are two types of wedge patterns:
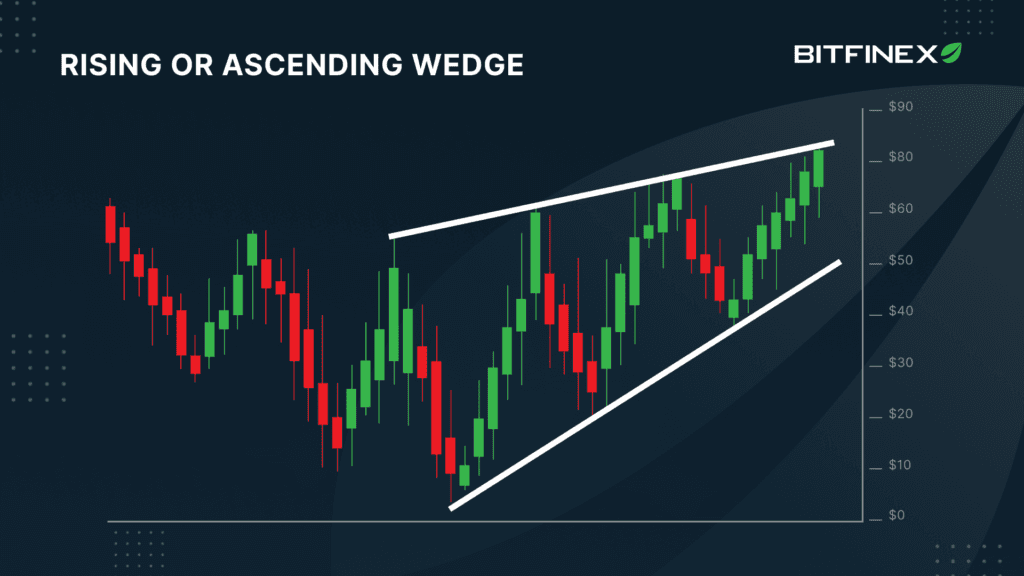
- Rising or ascending wedge
A rising wedge is marked by two lines slanting up from left to right, with the lower line ascending steeper than the upper one, forming a narrowing gap. It is generally considered a bearish signal, meaning the price is predicted to move downward.
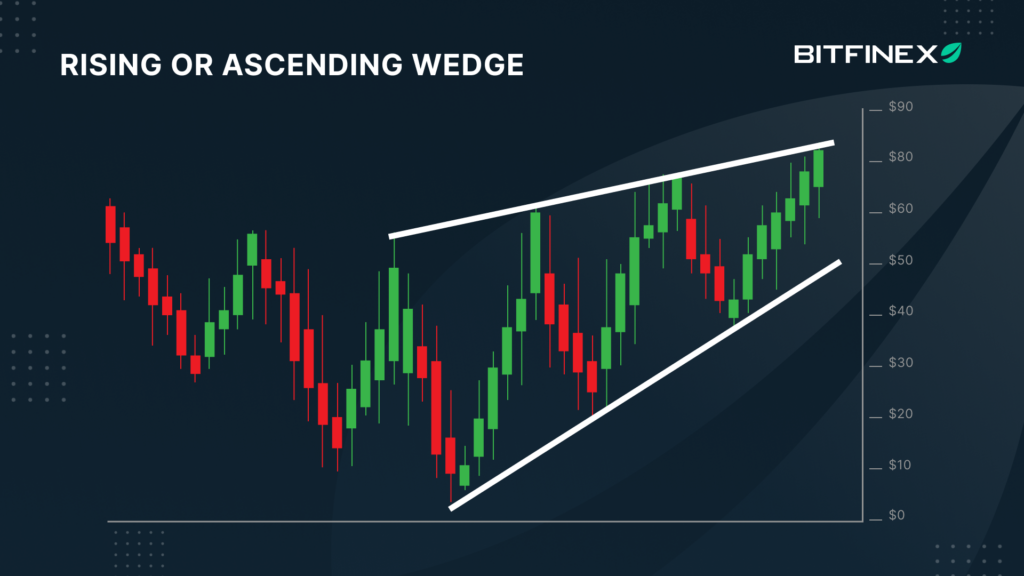
The rising wedge pattern can be formed in both an uptrend and a downtrend. When formed in an uptrend, it signals a reversal, which means the price is expected to move in a different direction and break the support line. When formed in a downtrend, it signals a trend continuation, so the price is expected to continue moving downward.
- Falling or descending wedge
A falling wedge is marked by two lines slant down from left to right, with the upper line descending steeper than the lower one, forming a narrowing gap. It is generally considered a bullish signal, meaning the price is predicted to move upward.
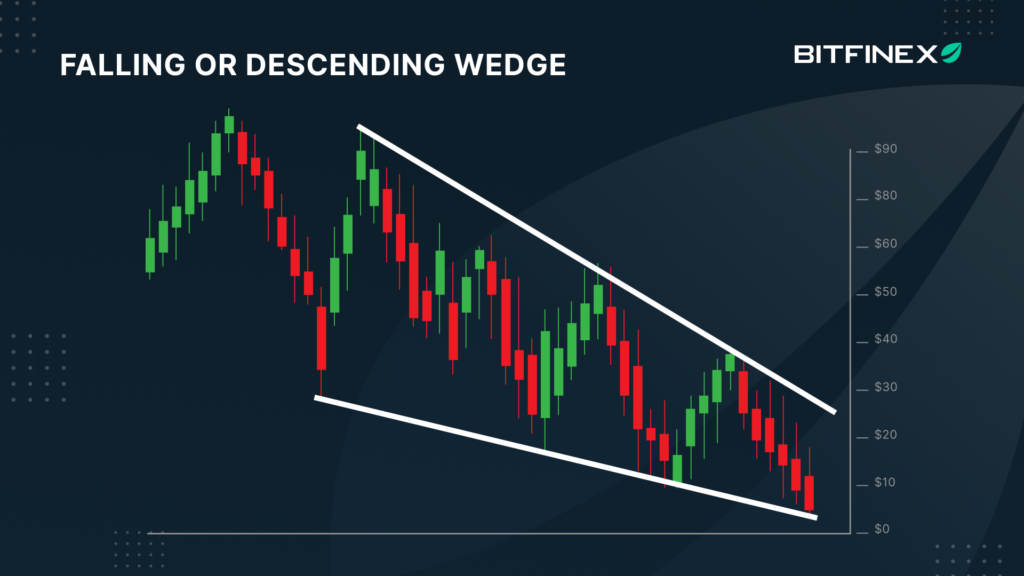
The rising wedge pattern can be formed in both an uptrend and a downtrend. When formed in an uptrend, it signals a continuation, which means the price is expected to continue moving upward. When formed in a downtrend, it signals a trend reversal, so the price is expected to move in a different direction and break the resistance line.
Time frame-wise, the wedge patterns can appear in all time frames, although traders typically use them in the shorter time frames to identify opportunities for price breakouts.
On the other hand, it is also argued that the wedge pattern is one of the most effective ways to identify opportunities for swing trading. Swing trading is a trading strategy that aims to profit from price movement over a few days up to several weeks. Some even believe that the wedge patterns spotted in longer time frames are more potent as it takes more effort to form them.
While it’s not too difficult to identify wedge patterns, professional traders usually use other technical indicators, such as Relative Strength Index (RSI), Moving Averages (MA), or Bollinger Bands, to validate the signals before taking action.
We will discuss technical indicators in the upcoming Bitfinex Trading 101 series, so stay tuned!Sign up to Bitfinex newsletter to make sure you won’t miss out or follow Bitfinex YouTube channel for insightful content in video format.
The post appeared first on Bitfinex blog.