By carefully analyzing the trades made by whales and institutional investors alike, we can see the intentions they have executed through each market cycle. In the broad scope, market cycles are driven by “smart” money to acquire “weak” money from average investors. Anticipating the moves that big traders will make to cause impulsive decisions in the market is where the Wyckoff method is useful.
What is the Wyckoff method?
The Wyckoff method was developed by Richard Wyckoff, an American writer, and stock market investor. Throughout his career, he became well-known for tracking the investment flow of institutional funds and offered guidance to investors and traders to help them avoid institutional influences. His analysis and techniques led to his creation of the Wyckoff Market Cycle.
Following which way markets ebb and flow and anticipating accumulation and distribution periods is what the method is designed to do. He named the influence of institutions and other large market players the Composite Operator and posited that the technique helps individuals predict and understand what the Composite Operator, as a whole, is thinking.
Wyckoff Schematics
There are four schematics to the Wyckoff Method. These four stages are the cause of a market’s or asset’s growth and decline. The stages are the Accumulation Phase, followed by the Markup Phase, the Distribution Phase, and the Markdown Phase.
The Accumulation Phase begins when demand from the Composite Operator has increased. The Composite Operator and the bulls look to grow their positions and then push prices higher. Once prices begin to grow, the Markup Phase is underway and leads into the Distribution Phase. As a new high is being reached, the opposite of the accumulation phase takes place. The Composite Operators and the market bears look to exit by selling and taking up their profits. The selloff creates a downward capitulation known as the Markdown Phase, dropping the price until another Accumulation Phase occurs.

Wyckoff’s Five-Step Approach
Within both the accumulation and the distribution schematics of the Wyckoff Method, there are five different phases that take place. Since this article is being written after the early signs of an accumulation phase, we’ll start there.
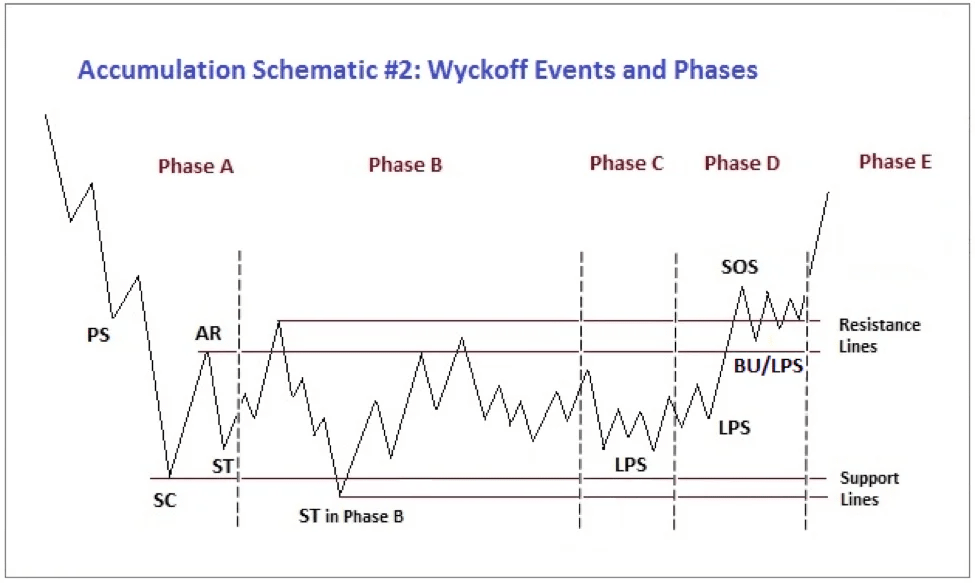
Source: Stockcharts.com
Phase A - At the tail end of a large capitulation, there is a distinct increase in trading volume, which signals preliminary support (PS). The efforts of this support ultimately don’t prevent the trend from finding a selling climax (SC), though, and we see large downward candlesticks emerge out of panic. Automatic buys and active purchases then cause an automatic rally (AR) to happen, and traders can take advantage of fallen prices.
These two min/max points of the SC and the AR usually mark a trading range in which the accumulation stage will occur. The end of Phase A happens after a secondary test (ST) occurs after the AR, dropping price again to signal the accumulation scheme isn’t over.
Phase B - Following the secondary test is a period where the Composite Operator is best able to accumulate the underlying asset. As the trading range is tested, premature bull and bear traps may occur, leaving opportunities for the Operator to take advantage.
Phase C - The end of Phase B can be determined by a definite bear trap designed to scare investors into selling. This is known as a Spring, and it may occur before low points begin climbing in prices. If there is no noticeable Spring or bear trap, that does not mean the rest of the schematic won’t occur.
Phase D - This is the transitory stage and is the last chance for investors and traders to buy at lower prices. As lows are priced at higher and higher points, there is eventually a Last Point Support (LPS). This is the highest low before the market breaks through resistance levels.
Signs of Support (SOS) are made where previous resistance prices used to be, making them new supports. As the support levels grow, a larger upward trend eventually occurs, leading into Phase E.
Phase E - An obvious surpassing of the trading range signifies a growth in the market demand. Investors are encouraged that the lowly accumulation phase is over, and buyers flood the market with confidence, and an uptrend occurs.
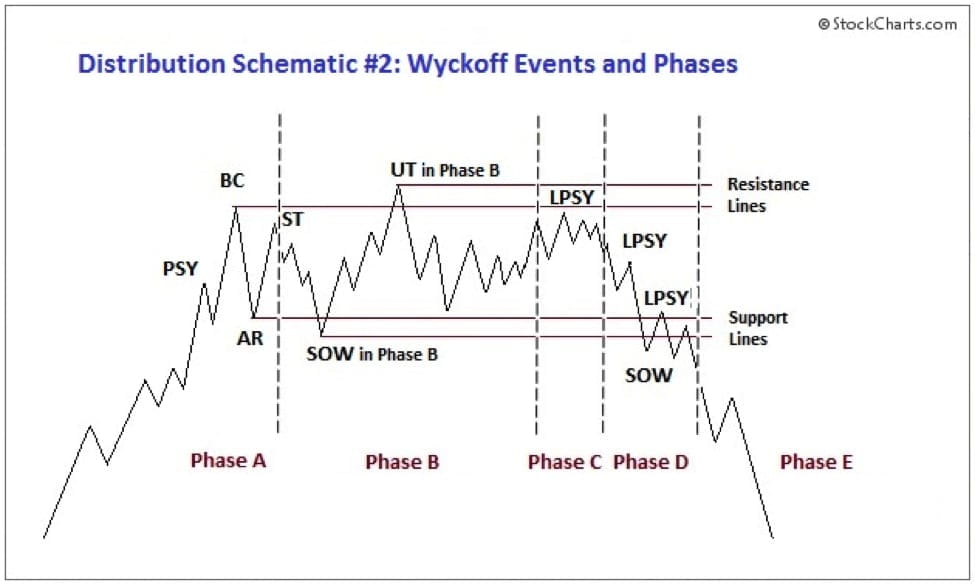
Source: Stockcharts.com
The distribution schematic has similar phases to the accumulation schematic, but with many of the same events along the way happening in the opposite direction.
Phase A - Arriving with the Markup Phase of the cycle is the Preliminary Supply (PSY), which demonstrates the first opportunity to sell for strong profit is nearing. The Buying Climax (BC) where the Composite Operator and bears first sell-off, creating a new resistance line. Price drops until a new Automatic Reaction (AR) occurs, bouncing the price up again to a Secondary Test (ST).
Phase B - Similar to Phase B of the Accumulation Schematic, in that, this is now where the Composite Operator will sell off its investments and realize profits from the previous schematic phases. Again, bear traps and bull traps may occur between the trading range. An Upthrust (UT) may also occur, briefly surpassing the BC, and setting a new resistance line.
Phase C - Just as with the Accumulation Schematic, this phase may or may not occur. An Upthrust After Distribution (UTAD) could find the market a new high. Whether or not this happens, Phase D eventually takes place.
Phase D - This is the last point for investors to sell at higher prices before the price begins to capitulate. Usually, a Last Point of Supply (LPSY) is found within the trading range, then a buy/sell reaction occurs, and another LPSY is located at or below the support line, triggering Phase E.
Phase E - The downward capitulation begins with a clear drop under the trading range as investors sell off, diminishing demands and tanking the price.
How to Trade the Wyckoff Approach on Crypto Futures
When it comes to using the Wyckoff approach in any sort of trading, firstly, it’s important to remember that no two cycles will be the same. There are too many external factors that affect markets for a cookie-cutter Wyckoff maneuver to happen each time.
It is crucial to keep up with the phases of each schematic, specifically where Phase A of either schematic has taken place. This phase will mark the lowest or the highest point (accumulation or distribution scheme, respectively) where you should place your stop-loss order.
The most effective time to enter a trade is Phase E of accumulation when a Markup is occurring. Tracking previous trends is useful here to determine what phase you’re in, potentially missing a new LPS or LPSY. Keeping an eye on trade volume can also help determine this moment.
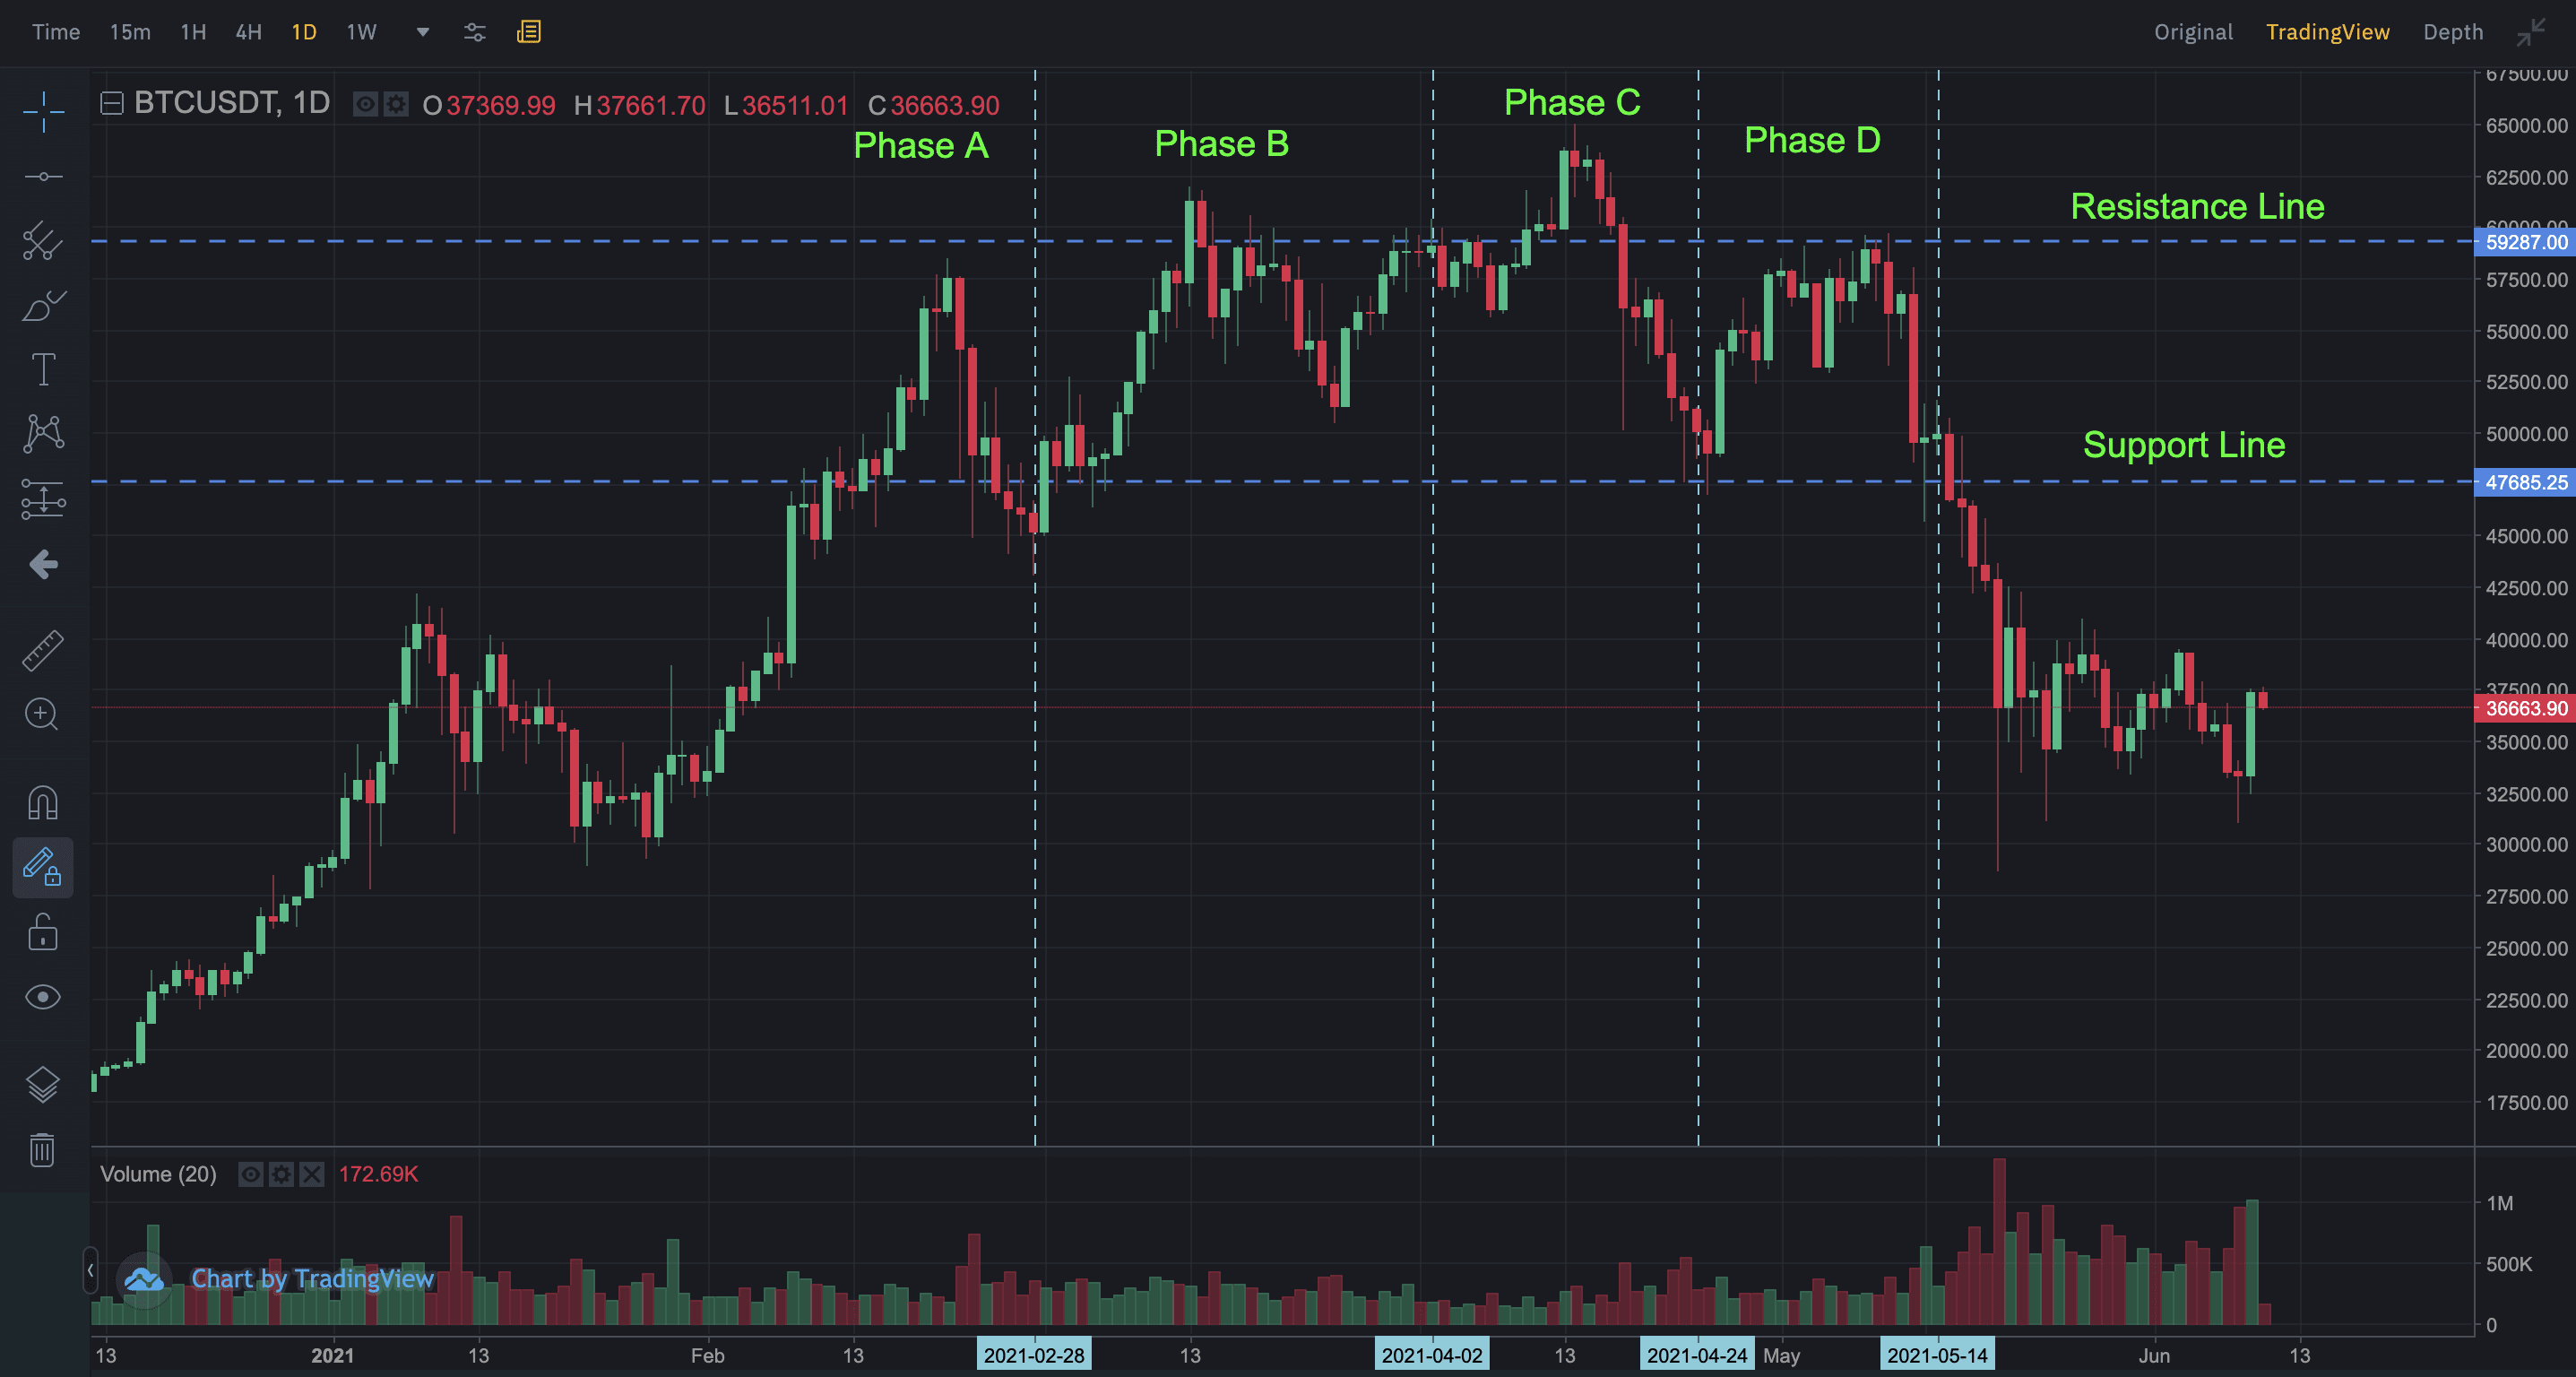
Over the first four months of 2021, the crypto market cycled through a distribution phase, as demonstrated in Binance BTCUSDT perpetual contract (graphic above). As an investor, it would have been helpful to note the first bounce, marking that a potential distribution phase has begun.
This chart perfectly matches the previous distribution phase chart and has each of the phases. For this cycle, it could have been advantageous to mark the support and resistance limits, set up stop losses, and prepare for a Bullish Spring (where the new all-time high occurred). In this Bullish Spring moment, the candlesticks weren’t green, signaling the Composite Operator had started to sell off, and a market correction was about to be underway.
At any rate, it is vital to remain open-minded about what is happening and what trend follows what, since the basic charts won’t always be a bulletproof guide. A scrutinous analysis is essential here.
Summing Up
Wyckoff’s market theory is founded on analyzing markets through the eyes of institutional investors. The trader must consider what these institutional operators' ultimate goals are and how current market behavior reflects their interests and behaviors.
Here’s a step-by-step approach to applying the Wyckoff method for your next trade:
Understand and analyze the current market cycle. Is it a bull or bear market, or perhaps sideways? In trending markets, wait patiently for the following change of character.
Mark the chart with events according to the accumulation and distribution schematics shown earlier.
Based on your analysis of events, determine the schematic phase.
Analyze volume and price action to study for footprints of institutional funds.
Wait for the best opportunities to long (short) risk/reward wise, which usually appears on varying setups in phases C and D.
Want to learn more about the Wyckoff method? Read more on Binance Academy.
Bottom Line
The Wyckoff Market Cycle method is ultimately a tool that is more than handy to have in your back pocket as a futures trader. Being aware of upcoming cycle trends and movements is crucial to setting up protective hedges, maximizing mark-ups, and avoiding loss to the Composite Operator.
If you’re not willing to simply hodl, and are interested in futures, it’s imperative to understand the movements of a market to be successful. In any case, have patience and watch with intent. Best of luck, traders!