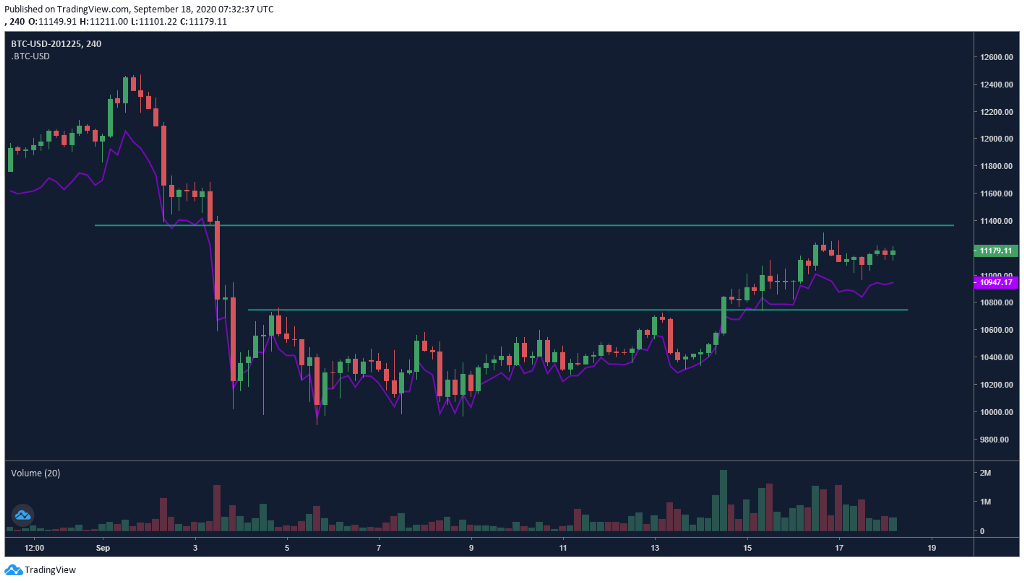
Market participants should also note that the OKEx Quarterly Future has moved from BTCUSD0925 to BTCUSD1225 because the former will expire next Friday.
Given how the quarterly future expiry date has shifted to the end of December, the most obvious result is that the BTC Basis is back above 2%. What is not so obvious, however, is why the BTC long/short ratio has continued to decline as prices kept moving up in the week. As the long/short ratio continues to hit record lows, one explanation could be arbitrageurs moving their BTC to the Ethereum blockchain for yield-farming and hedging their positions using derivatives.
Open interest, on the other hand, had a smooth run this week, accumulating back to above $900 million. We didn’t observe any big moves from whales, but the spot leveraged market appears less confident that prices will continue to rise. This, coupled with the dropping long/short ratio hint toward a possible consolidation period in the mid- to short-term.
OKEx trading data readings
Visit OKEx trading data page to explore more indicators
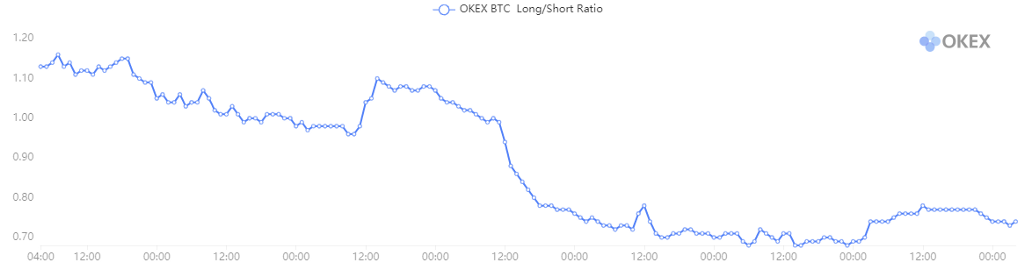
BTC long/short ratio
The long/short ratio continued to decline during the week, even as the price of Bitcoin rose to $11,000, and stood at 0.68 when BTC recorded its weekly high at $11,300.
Two possible explanations for this behavior include retail traders entering shorts at high prices due to lack of confidence in further appreciation, and yield farmers hedging their BTC positions via derivatives after moving their assets to Ethereum.
The long/short ratio compares the total number of users opening long positions versus those opening short positions. The ratio is compiled from all futures and perpetual swaps, and the long/short side of a user is determined by their net position in BTC. In the derivatives market, whenever a long position is opened, it is balanced by a short position. The total number of long positions must be equal to the total number of short positions. When the ratio is low, it indicates that more people are holding shorts.
The current long/short ratio of 0.7 is clearly around an all-time low, far below last week’s average of 1.1. However, in the future, when hedged short positions are closed, they will act as strong longs.
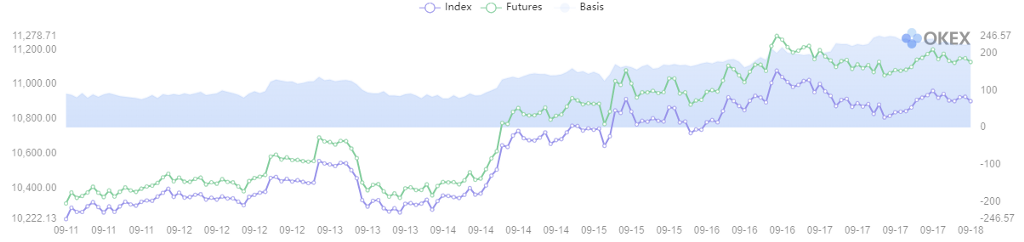
BTC basis
While we saw negative premiums for quarterly futures during the week, the basis recovered to around $100 after the quarterly futures contract shifted to December.
This indicator shows the quarterly futures price, spot index price and also the basis difference. The basis of a particular time equals the quarterly futures price minus the spot index price. The price of futures reflects the traders’ expectations of the price of Bitcoin. When the basis is positive, it indicates that the market is bullish. When the basis is negative, it indicates that the market is bearish. The basis of quarterly futures can better indicate the long-term market trend. When the basis is high (either positive or negative), it means there’s more room for arbitrage.
The premium had dipped to as low as $75 on Monday morning, but three consecutive days of gains during the week sent it soaring, and it is now above 2.0%, or $200.
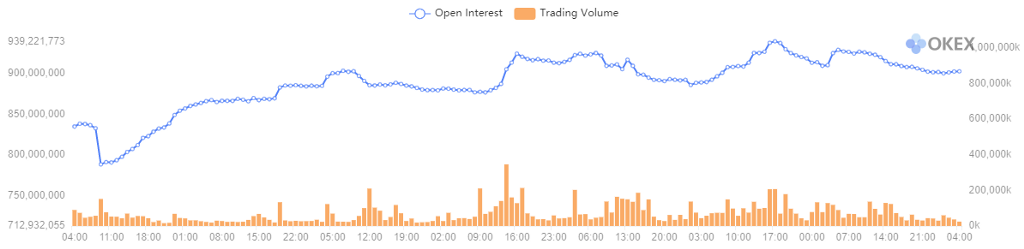
Open interest and trading volume
The open interest dropped to a recent low of $788 million last Friday before bouncing back to its current value around $900 million. However, this week’s price appreciation was not accompanied by a significant uptick in trading volume.
Open interest is the total number of outstanding futures/swaps that have not been closed on a given day. Trading volume is the total trading volume of futures and perpetual swaps over a specific period of time. If there are 2,000 long contracts and 2,000 short contracts opened, the open interest will be 2,000. If the trading volume surges and the open interest decreases in a short period of time, it may indicate that a lot of positions are closed, or were forced to liquidate. If both the trading volume and open interest increase, it indicates that a lot of positions have opened.
Changes in OI were more in line with price movements this week, and the absence of rapid OI surges as the price dropped indicates a lack of whales entering shorts.
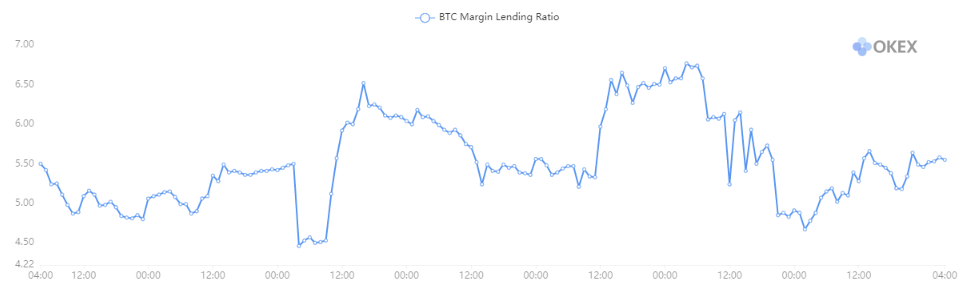
BTC margin lending ratio
The BTC margin lending ratio appeared rather random during the week. Although still moving with the price, the changes were minimal, as it basically hovered between 4.5 and 6.8.
The margin lending ratio This ratio also helps traders to look into market sentiment. Generally, traders borrowing USDT aim to buy BTC, and those borrowing BTC aim to short it. When the margin lending ratio is high, it indicates that the market is bullish. When it is low, it indicates that the market is bearish. Extreme values of this ratio have historically indicated trend reversals. is spot market trading data showing the ratio between users borrowing USDT versus borrowing BTC in USDT value over a given period of time.
Notably, the ratio slipped rapidly after Bitcoin’s run above $11,000 on Wednesday, indicating a lack of confidence among spot leveraged traders that the price would continue to rise.
Visit https://www.okex.com/ for the full report.
Disclaimer: This material should not be taken as the basis for making investment decisions, nor be construed as a recommendation to engage in investment transactions. Trading digital assets involve significant risk and can result in the loss of your invested capital. You should ensure that you fully understand the risk involved and take into consideration your level of experience, investment objectives and seek independent financial advice if necessary. OKEx Insights presents market analyses, in-depth features and curated news from crypto professionals.
Not an OKEx trader? Sign up and start trading today!

was originally published in OKEx Blog on Medium, where people are continuing the conversation by highlighting and responding to this story.


