Bitfinex Trading 101 series will bring you content around crypto trading knowledge, including Bitfinex platform-related topics. In the first round of the series, we will talk about the three types of charts commonly used in crypto trading.
Bar chart
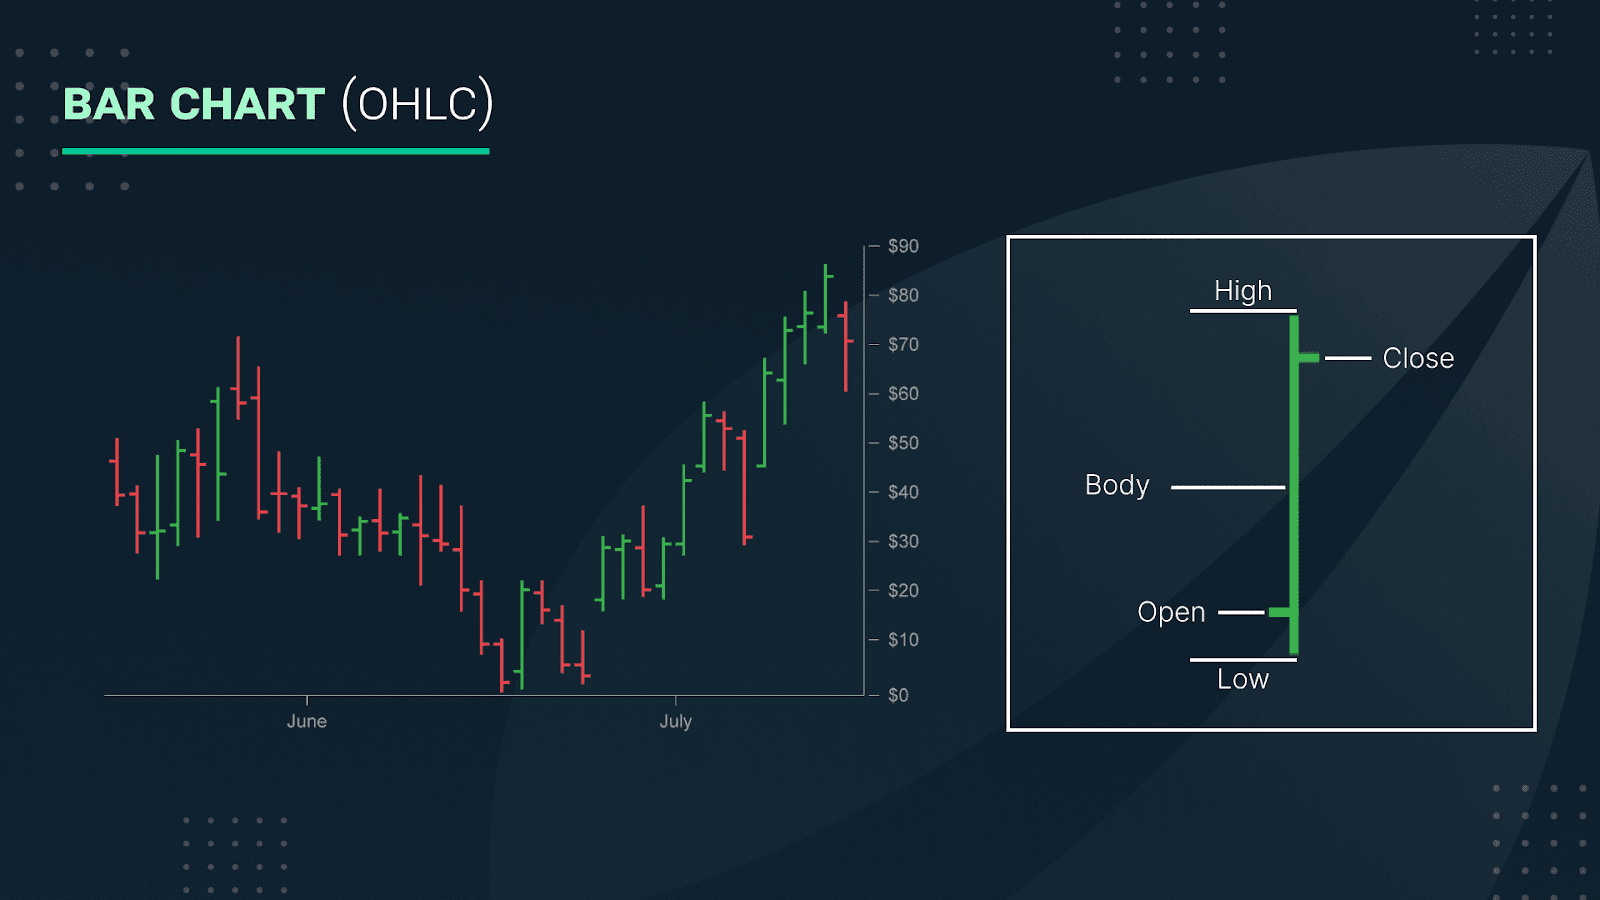
A bar chart, also known as an OHLC (open-high-low-close) chart, is a chart that visualises the price movement of an asset in a given period, e.g., one minute, one hour or one trading day. As the acronym suggests, a bar chart comprises four elements—opening, highest, lowest, and closing prices.
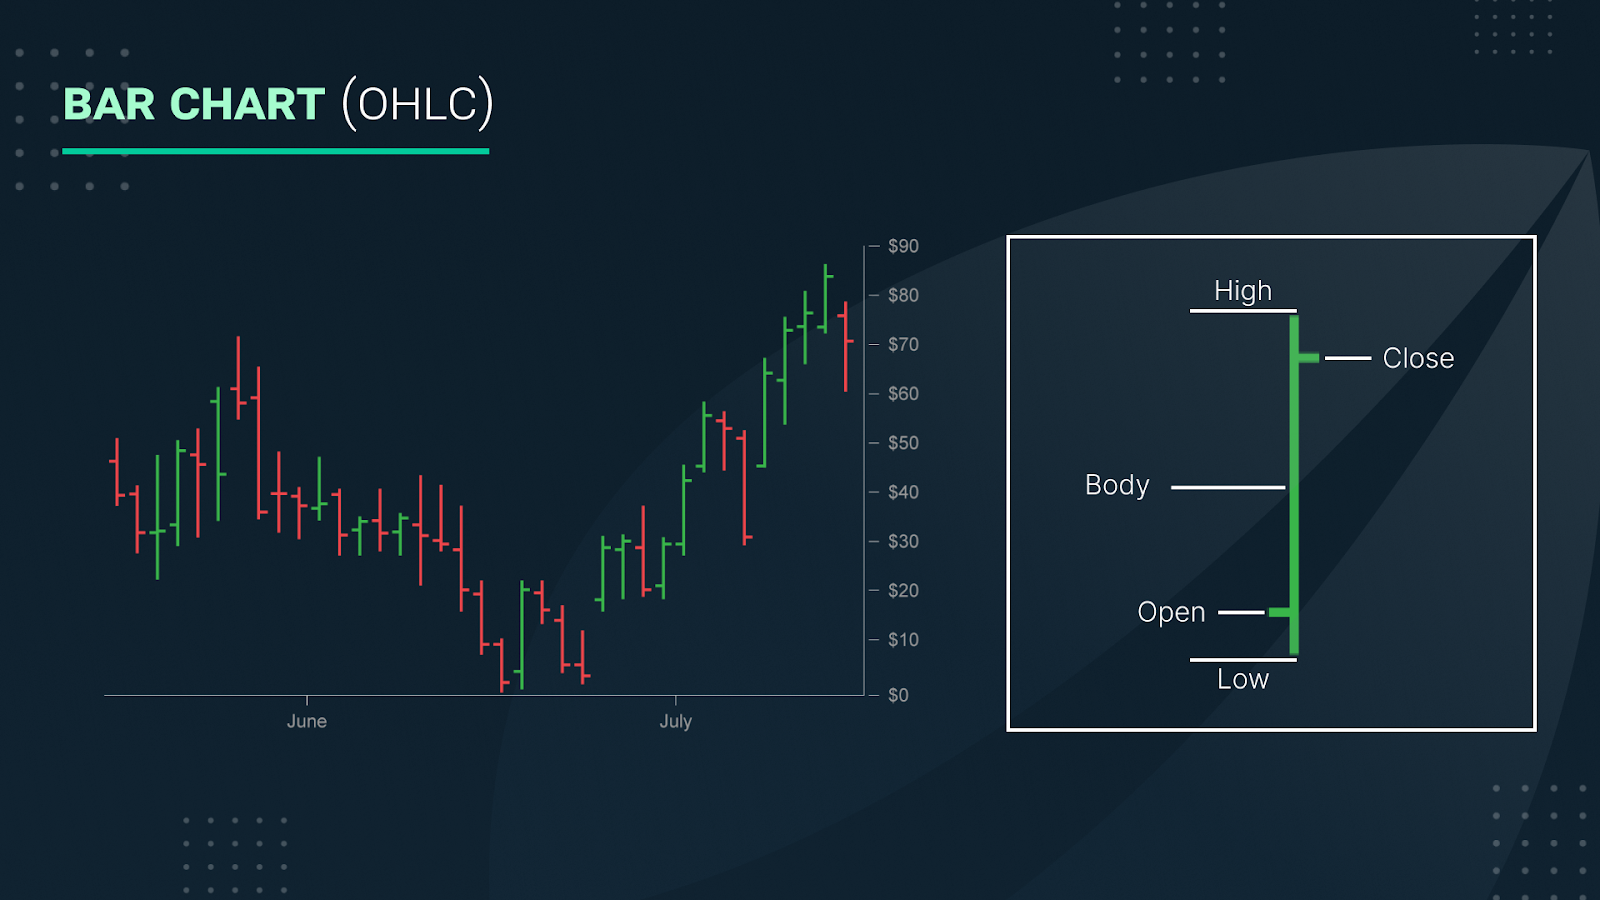
The body of the chart shows the price range within the selected period. The top of the chart is the highest price, while the bottom is the lowest price.
A bar chart typically has two horizontal lines attached to the body that refer to the opening and closing price within the chosen period. The opening price is referred to by the line on the left side. Meanwhile, the closing price is referred to by the line on the right side.
The chart is typically coloured in either red or green, but there’s also the blue version. Red is when the opening price is higher than the closing price, which is interpreted as a bearish market trend. On the other hand, green/blue is when the opening price is lower than the closing price, which indicates a bullish market trend.
Bar charts are very popular amongst traders since it’s useful for price action monitoring, analysing trends and spotting reversals. At the same time, it’s relatively easy to read and interpret.
Candlestick chart
The Candlestick chart was invented in the 18th century by a Japanese rice trader named Munehisa Homma, who thought that trading charts should also show the emotions of the traders.
A candlestick comprises three parts—the body, upper shadow and lower shadow. The upper shadow is also called wick, whereas the lower shadow is called tail.
Each candlestick represents trading information within a specific period, e.g., a 10-minute candlestick represents 10 minutes of trading data.
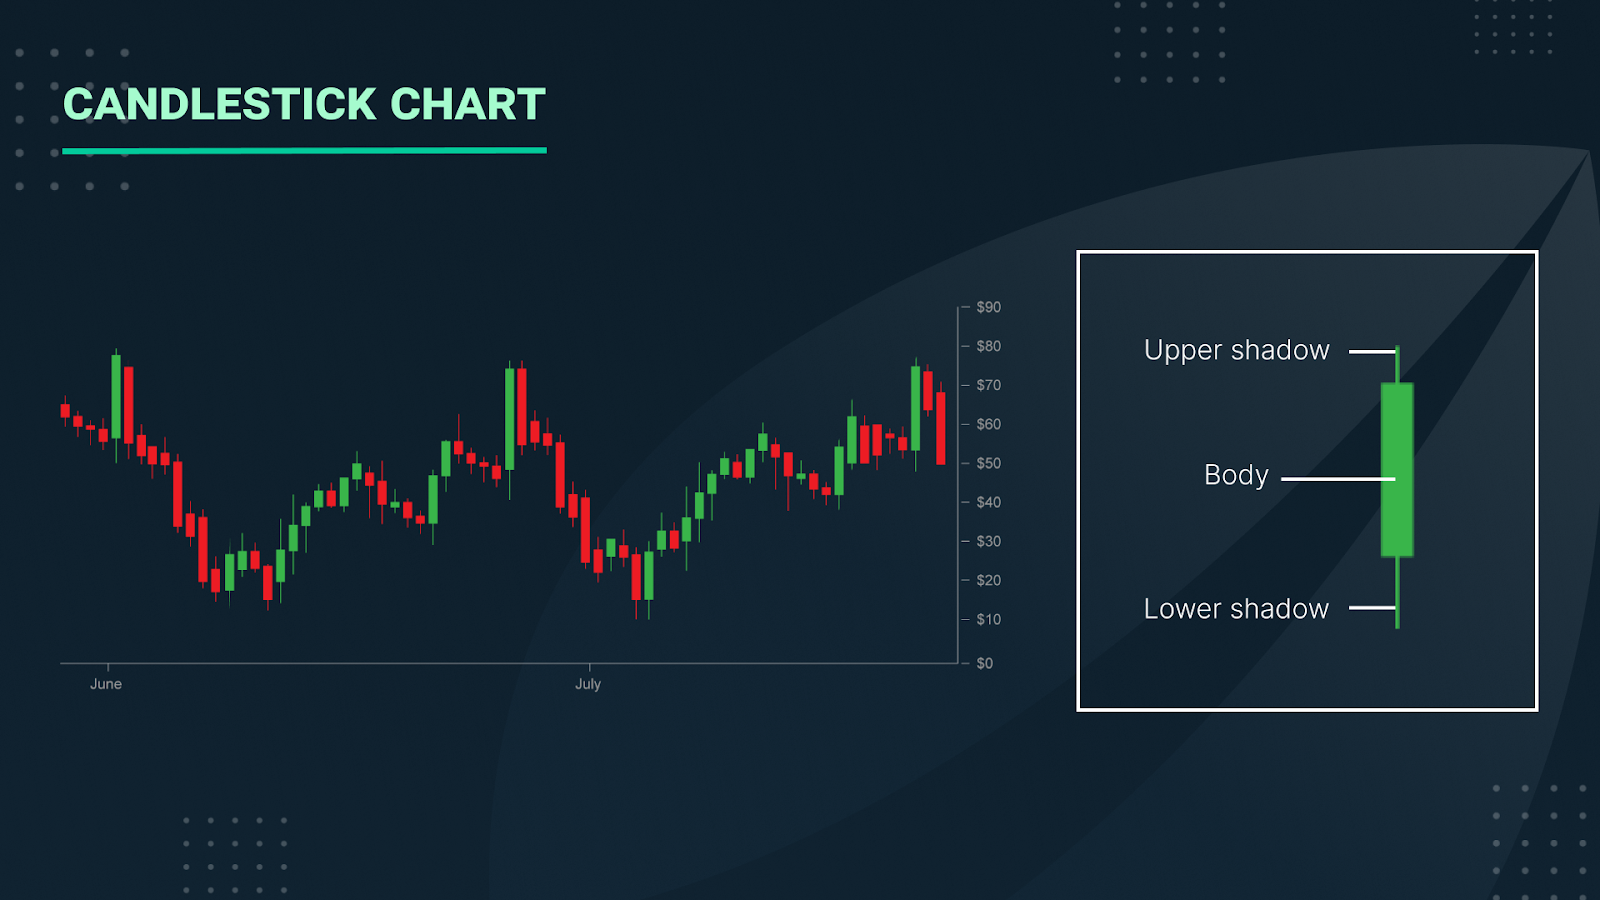
The body can be in either green or red colour, depending on the data. If the closing price is higher than the opening price, the body is coloured green, suggesting a net price gain. The body is coloured red if the closing price is lower than the opening price, suggesting a net price decline.
This colour is what Homma referred to as the emotions of the traders.
Heikin-Ashi chart
In Japanese, Heikin means average, Ashi means pace. Combined in a trading context, Heikin-Ashi means the average pace of prices.
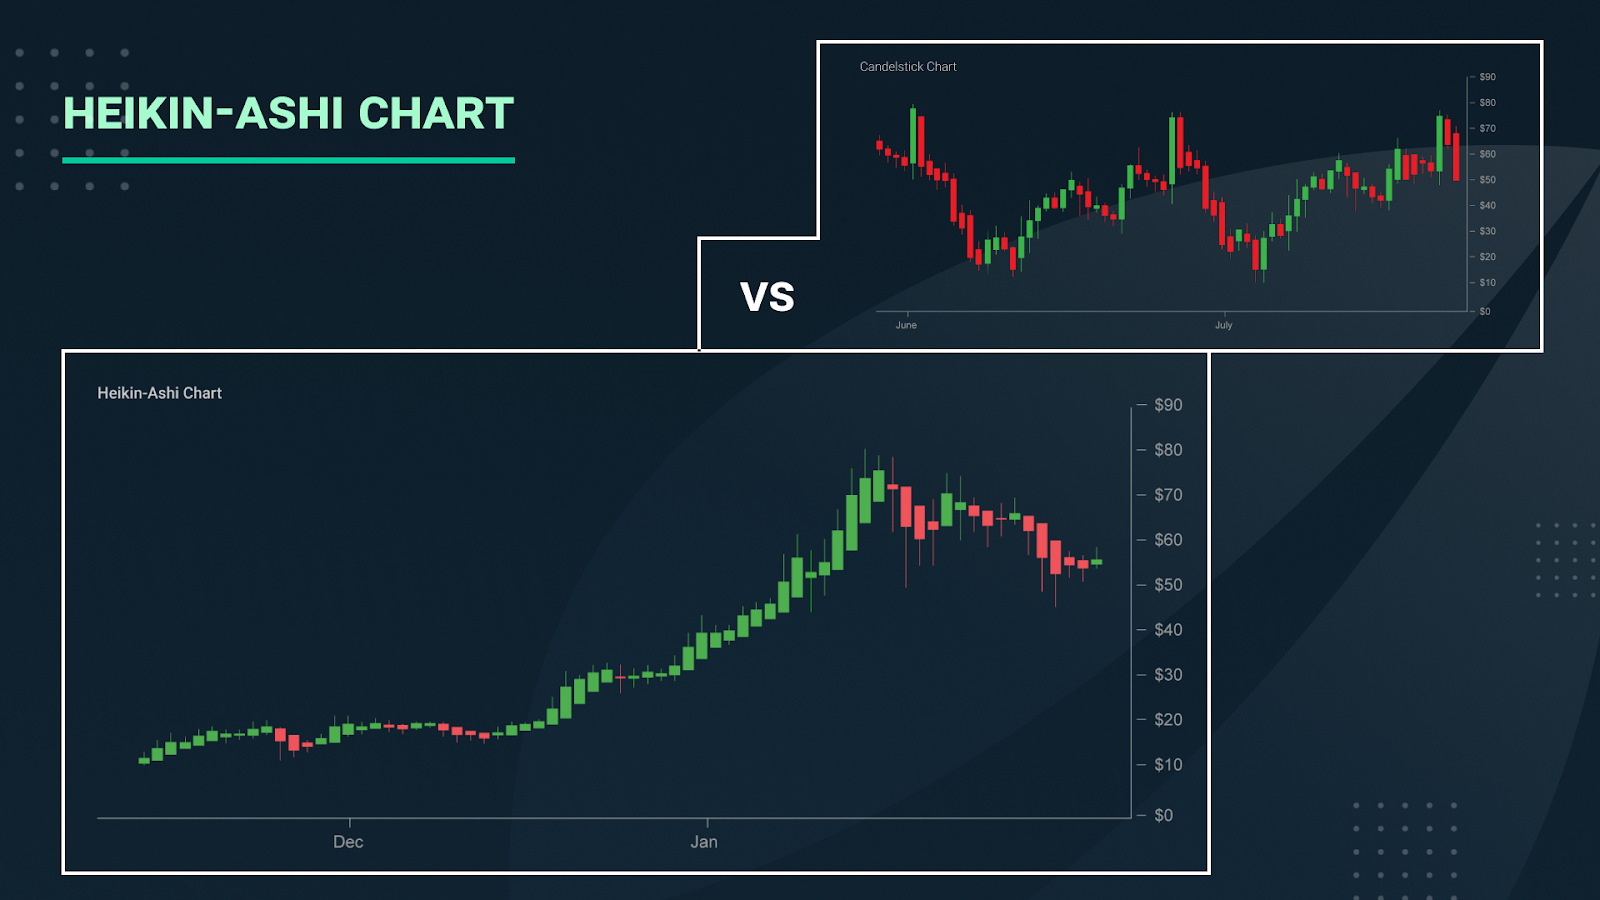
At a glance, Heikin-Ashi charts look like standard candlestick charts. However, since it uses average price data, Heikin-Ashi charts will appear smoother than candlestick charts, when both are compared side-by-side for the same trading data and time frame.
The formula used in Heikin-Ashi charts is as follow:
HAO = (Open of previous bar + Close of previous bar) / 2
HAC = (Open + High + Low + Close) / 4
HAH = Highest of High, Open, or Close
HAL = Lowest of Low, Open, or Close
where:
HAO = Heikin-Ashi Open
HAC = Heikin-Ashi Close
HAH = Heikin-Ashi High
HAL = Heikin-Ashi Low
Using average price data means that Heikin-Ashi charts make trends, potential reversal points and price patterns easier to spot. On the other hand, it also means there is some data loss from the calculation, which should be taken into consideration as it could relate to the level of risk.
Subscribe to the Bitfinex newsletter for more insightful content.
The post appeared first on Bitfinex blog.