When Can We Confirm A Bullish BTC Or Crypto Market?
Some of the most frequently asked questions in the Crypto space are: “Are we in an uptrend?” “Has the bullish market started yet?”. So how do we determine when a bull market started, and when one has ended? That is what we will explore in this blog. Stay tuned until the end to find out.
How do we determine a bullish market based on technical indicators?
Identifying a bullish market starts by selecting the right timeframe. The right timeframes, in this case, are the ones that are usually used by position traders, are either the 1-week or the 1-day timeframe.
We will then need to select the right technical indicators. Trend-following indicators are usually the most appropriate here.
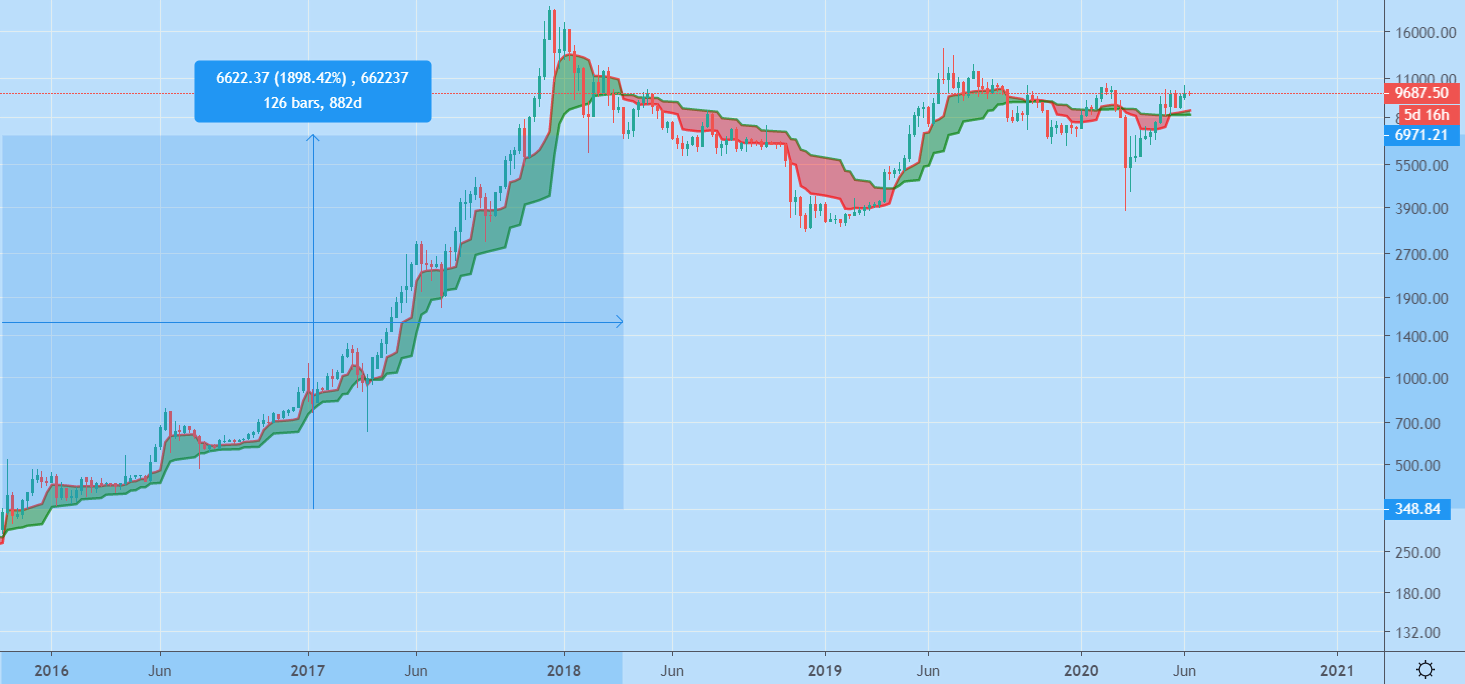
MESA Weekly Chart
The MESA is displayed as a green cloud during bullish market conditions, and as a red cloud during bearish market conditions.
This indicator should only be used when trying to identify major bullish moves (lasting at least 180 days). The MESA on the weekly chart identified a bullish uptrend on the 26th of October 2015 until the 26th of March 2018.
Even if you had just held this position over 882 days, you would have made an almost 2,000% profit. This bullish market was so long that we had to use the logarithmic chart to fit it well in the figure below.
Like all indicators, this one isn’t perfect. It can give out fake signals, such as between the 3rd of February and the 2nd of March, when you would have ended up in a loss, had you traded solely based on this.

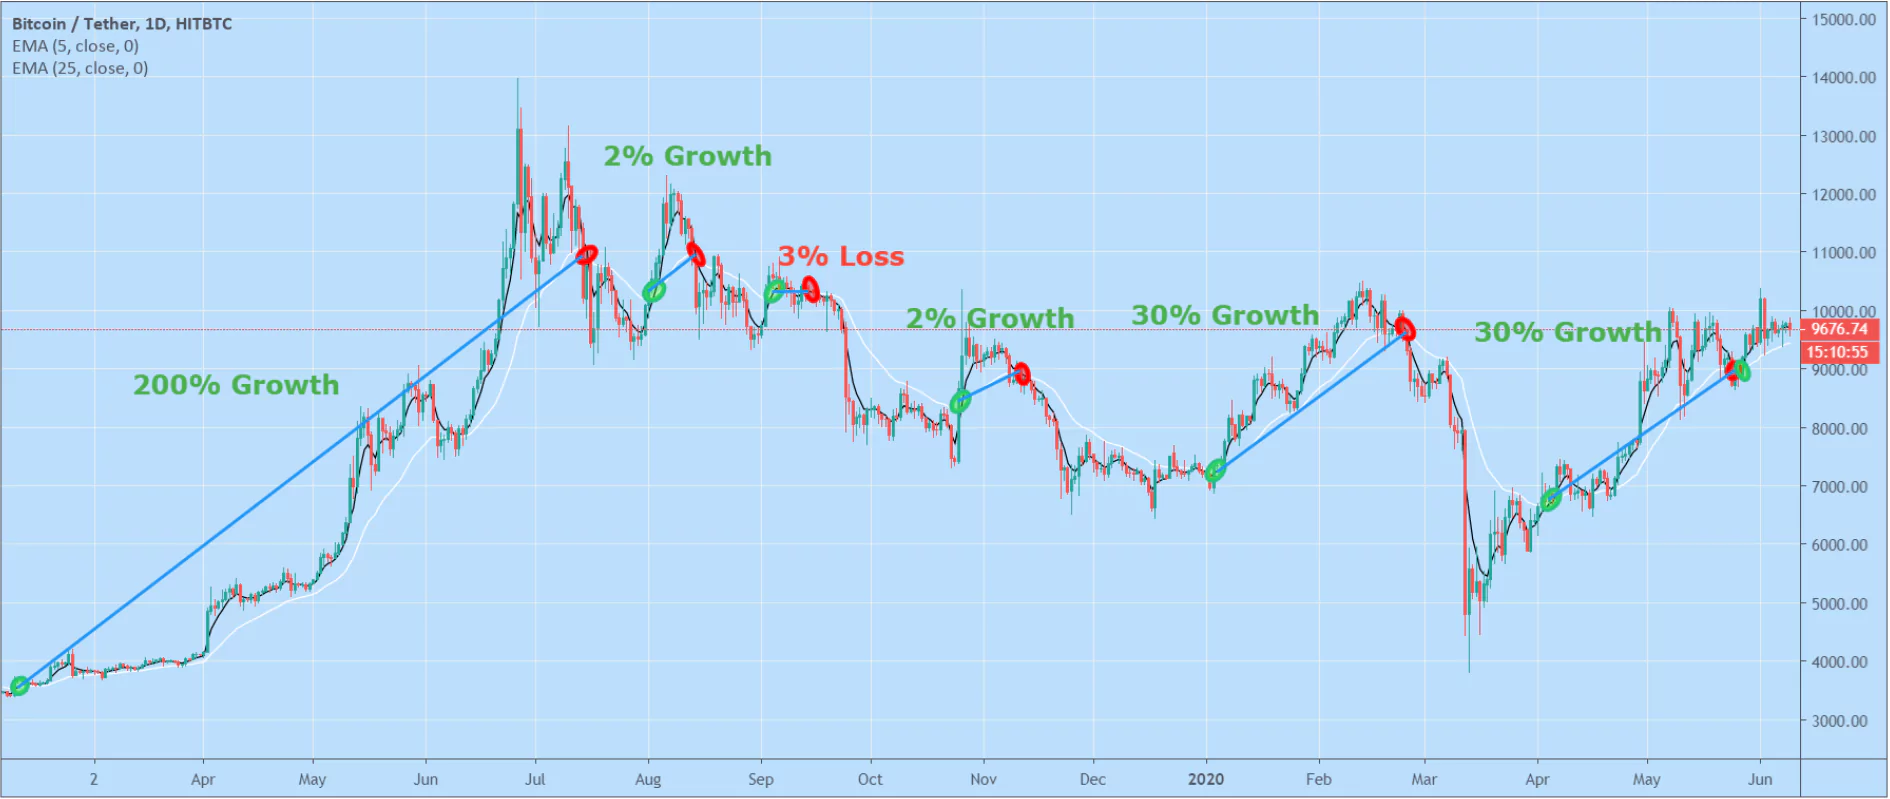
Crossover Of The 5 + 25 EMA Daily Chart
The crossover of the 5 and 25 EMA on the daily chart is another option for identifying bullish and bearish markets.
This indicator reacts faster to change than the previous option. Therefore it will indicate when a bull market started and ended before the MESA on the Weekly chart.
As shown in the graph below, this indicator isn’t perfect either. However, if you had solely used this indicator over the past year, you would have made around a 500% gain. So if you started with $1,000, then you will end up with $1,000*3*1.02*0.97*1.02*1.3*1.3= $5,117.

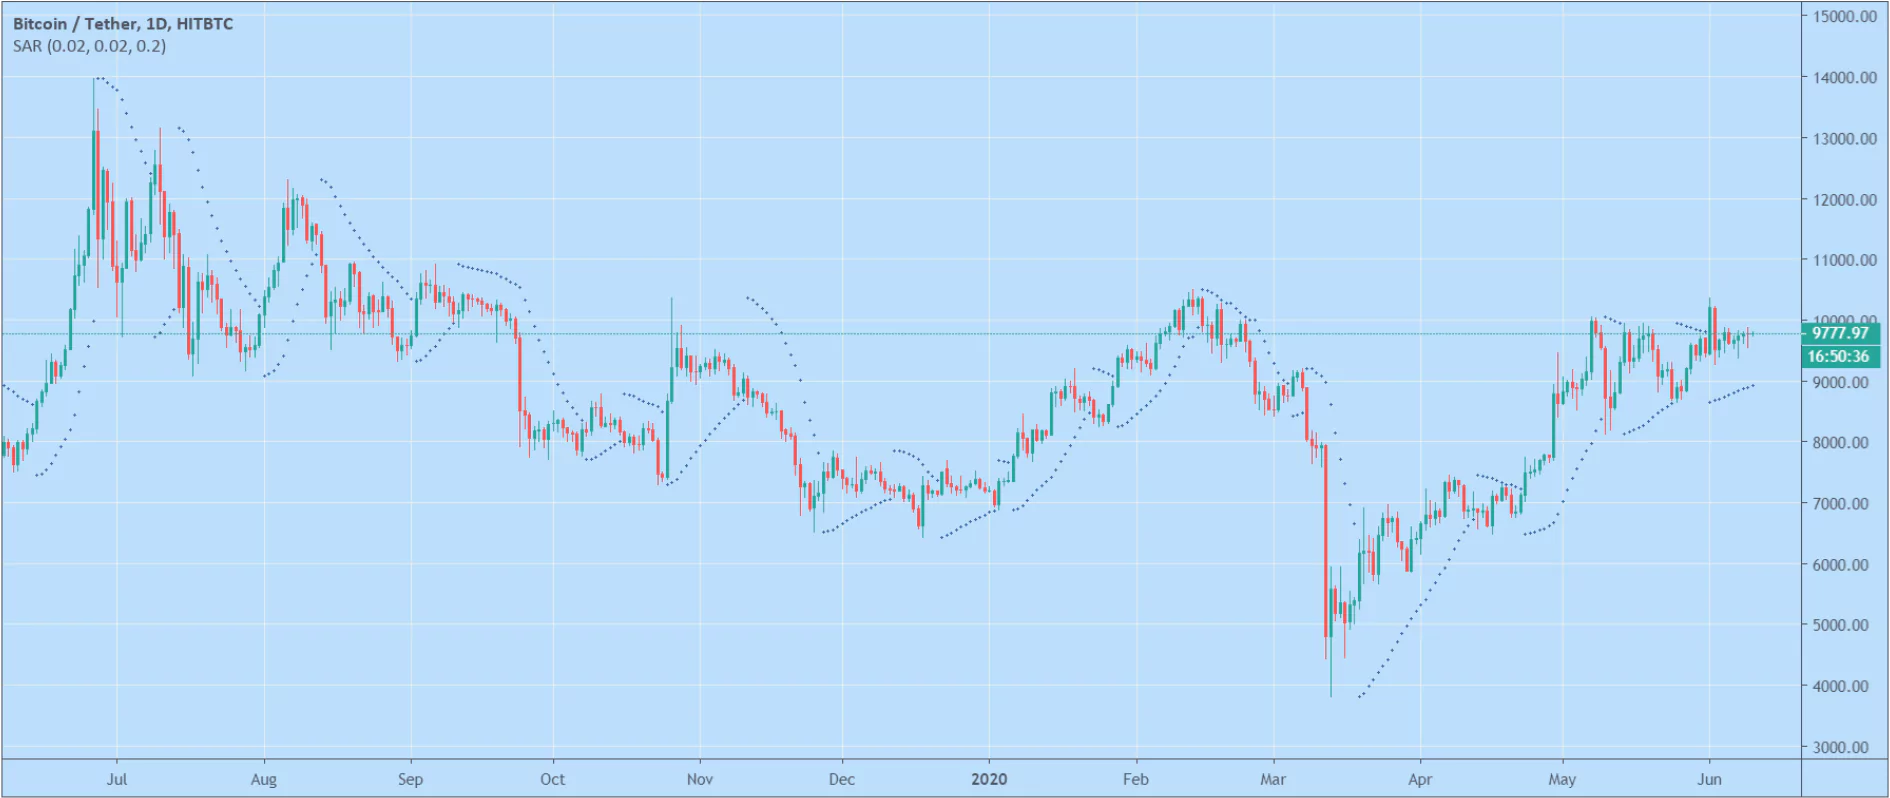
Parabolic SAR Daily Chart
Last but not least, we have the Parabolic SAR on the daily chart.
The Parabolic SAR reacts the fastest out of all of the other options presented in this blog. The indicator is displayed by dots underneath the price in bullish market conditions and dots above the price in bearish market conditions.
This indicator can be used as a stop loss by position takers. It is particularly useful for scalpers who use strategies that are very dependent upon market conditions.

Conclusion
Selecting the right timeframe is the first step to identifying a bullish market. The daily and weekly timeframes are the most common choices.
You can then use trend following-indicators such as the MESA, EMA Crossovers, and the Parabolic SAR to identify the direction of the current trend.
All of the indicators mentioned in this blog are available at Cryptohopper. You can add them to your fully automated strategy to make sure you are only trading during bullish market conditions.

