3 Crypto Chart Pattern Rules to Build Around
Not all chart patterns are created equal. To discern a low-probability chart pattern from a high-probability one, you need to have a foundation to build around.
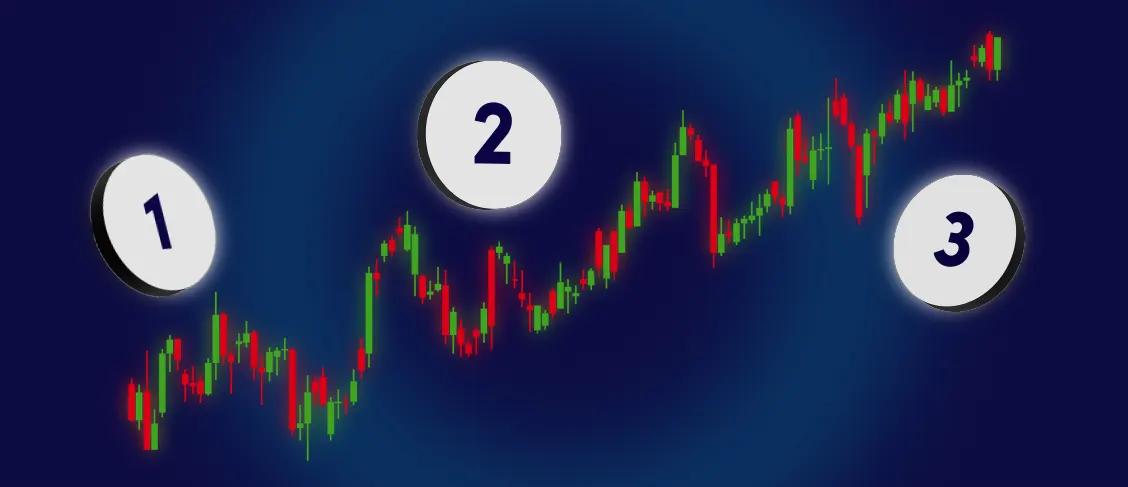
There are three rules by which we can analyze any price action pattern. If the price action can successfully pass the 3-rule test, we’re potentially dealing with a high-probability setup.
Here are the three rules:
Candlesticks with big wicks
Relatively bigger candles compared to the nearby candles
Market conditions (trend, range, or breakout mode)
Candlestick Wicks
An essential feature of the candlesticks is the wicks. The size of the wick is only meaningful in relation to the candle body and the nearby candle wicks.
For example, long candlestick wicks show more than just price rejection. When long wicks are part of a chart pattern, and within the context of a trend, we want to pay attention because it can signal the end of the trend.
We have added some examples of Candlestick wicks to show their importance.
Gravestone Doji

The Gravestone Doji is a bearish reversal pattern represented by one candle.
This candle has the low, open and closes around the same price, while the higher features a long upper wick. As it was explained during other Doji patterns, Dojis are indecision patterns. Their shape determines whether they have higher chances to lead to rises or falls in the price.
On this occasion, the Doji has a long upper wick, which indicates that the bears are more present in the market and the price is more likely to go down. Therefore, if selected in an automated strategy, this pattern will signal a sell when spotted in the chart.
Hammer
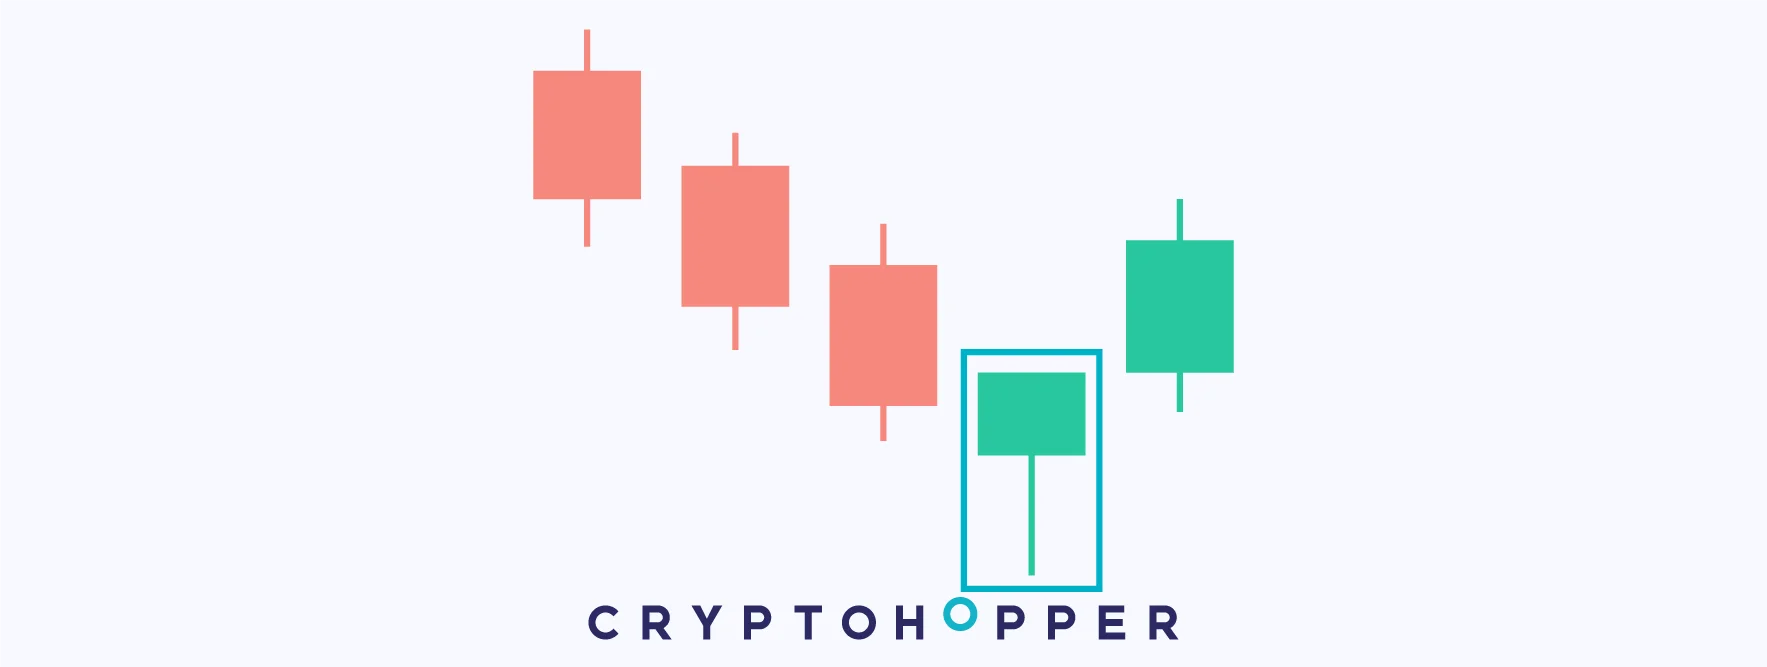
A Hammer is a bullish reversal pattern formed by one candle.
It has a short body at the top and a long lower wick. That is, its opening, closing, and maximum are very close to each other. However, the minimum is relatively far from them.
Commonly found during downtrends, its long lower wick suggests that the demand has strongly rejected the price when it tried to continue its way downwards. Then, suggesting that the demand is very present at that price and that it can reverse its trend.
Usually, a Hammer precedes an upwards trend reversal or pullback. Therefore, whenever it appears in a chart, it implies that the price is likely to increase and can be interpreted as a buy signal. Also, it can be easily combined with other indicators to reinforce the entry points.
Candlestick Price Range
The candlestick price range is the second criteria by which we want to analyze every chart pattern. A wide range of candlesticks is another sign of confirmation of relatively good price action.
Market Conditions
Market context is everything when we analyze chart price action. We want to trade only when the market conditions are favorable to our trade pattern.
For example, if the head and shoulder pattern forms within a consolidation, that’s not a reliable trade setup. The head and shoulder pattern is only valid when it forms within an uptrend.
Bottom Line: We want the price action we trade to pass the three-rule test before risking our money. These are only general guidelines, and some discretion is required to master price action trading.


_webp.webp&w=3840&q=75)
_webp.webp&w=3840&q=75)


