.webp&w=3840&q=75)
.webp&w=3840&q=75)
#crypto exchange#Web3.0#Web 3.0 / DeFi / NFT / dApps / Metaverse+1 plus de tags
Blog de Cryptohopper
#Cryptocurrency#crypto trading tips#Cryptocurrency trading+2 plus de tags
The Only Tip You Need to Know to Buy the Dip Early
The principles governing buying the dip are the same across any market, including the cryptocurrency market. In layman’s terms, buying the dip is a strategy that involves purchasing a crypto asset after the price has dropped.
Nouveautés


Filtrer par thème18 août 2022 • 5 min de lecture 8 août 2022 • 5 min de lecture
_webp.webp&w=3840&q=75)
#Bitcoin#crypto trading tips#Bitcoin trading+2 plus de tags
How to Find Support and Resistance Levels: Tips for Traders
The principles governing buying the dip are the same across any market, including the cryptocurrency market. In layman’s terms, buying the dip is a strategy that involves purchasing a crypto asset after the price has drop…

#Technical analysis#support and resistance#Relative Strength Index+2 plus de tags
Celsius’ RSI is Now most Overbought it Has Ever Been, What’s Next?
15 août 2022 • 2 min de lecture
#Bitcoin#Cryptocurrency#Bitcoin trading+2 plus de tags
Bitcoin’s Rising Bullish Channel Caps Downside at $20,000
12 août 2022 • 2 min de lecture.webp&w=3840&q=75)
#Cryptocurrency#cryptohopper#crypto trading+2 plus de tags
How to Trade the V-Shaped Bottom?
11 août 2022 • 3 min de lecture
#Cryptocurrency#crypto trading tips#Cryptocurrency investment+2 plus de tags
Six Factors to Consider While Investing in a Crypto Bear Market
10 août 2022 • 7 min de lecture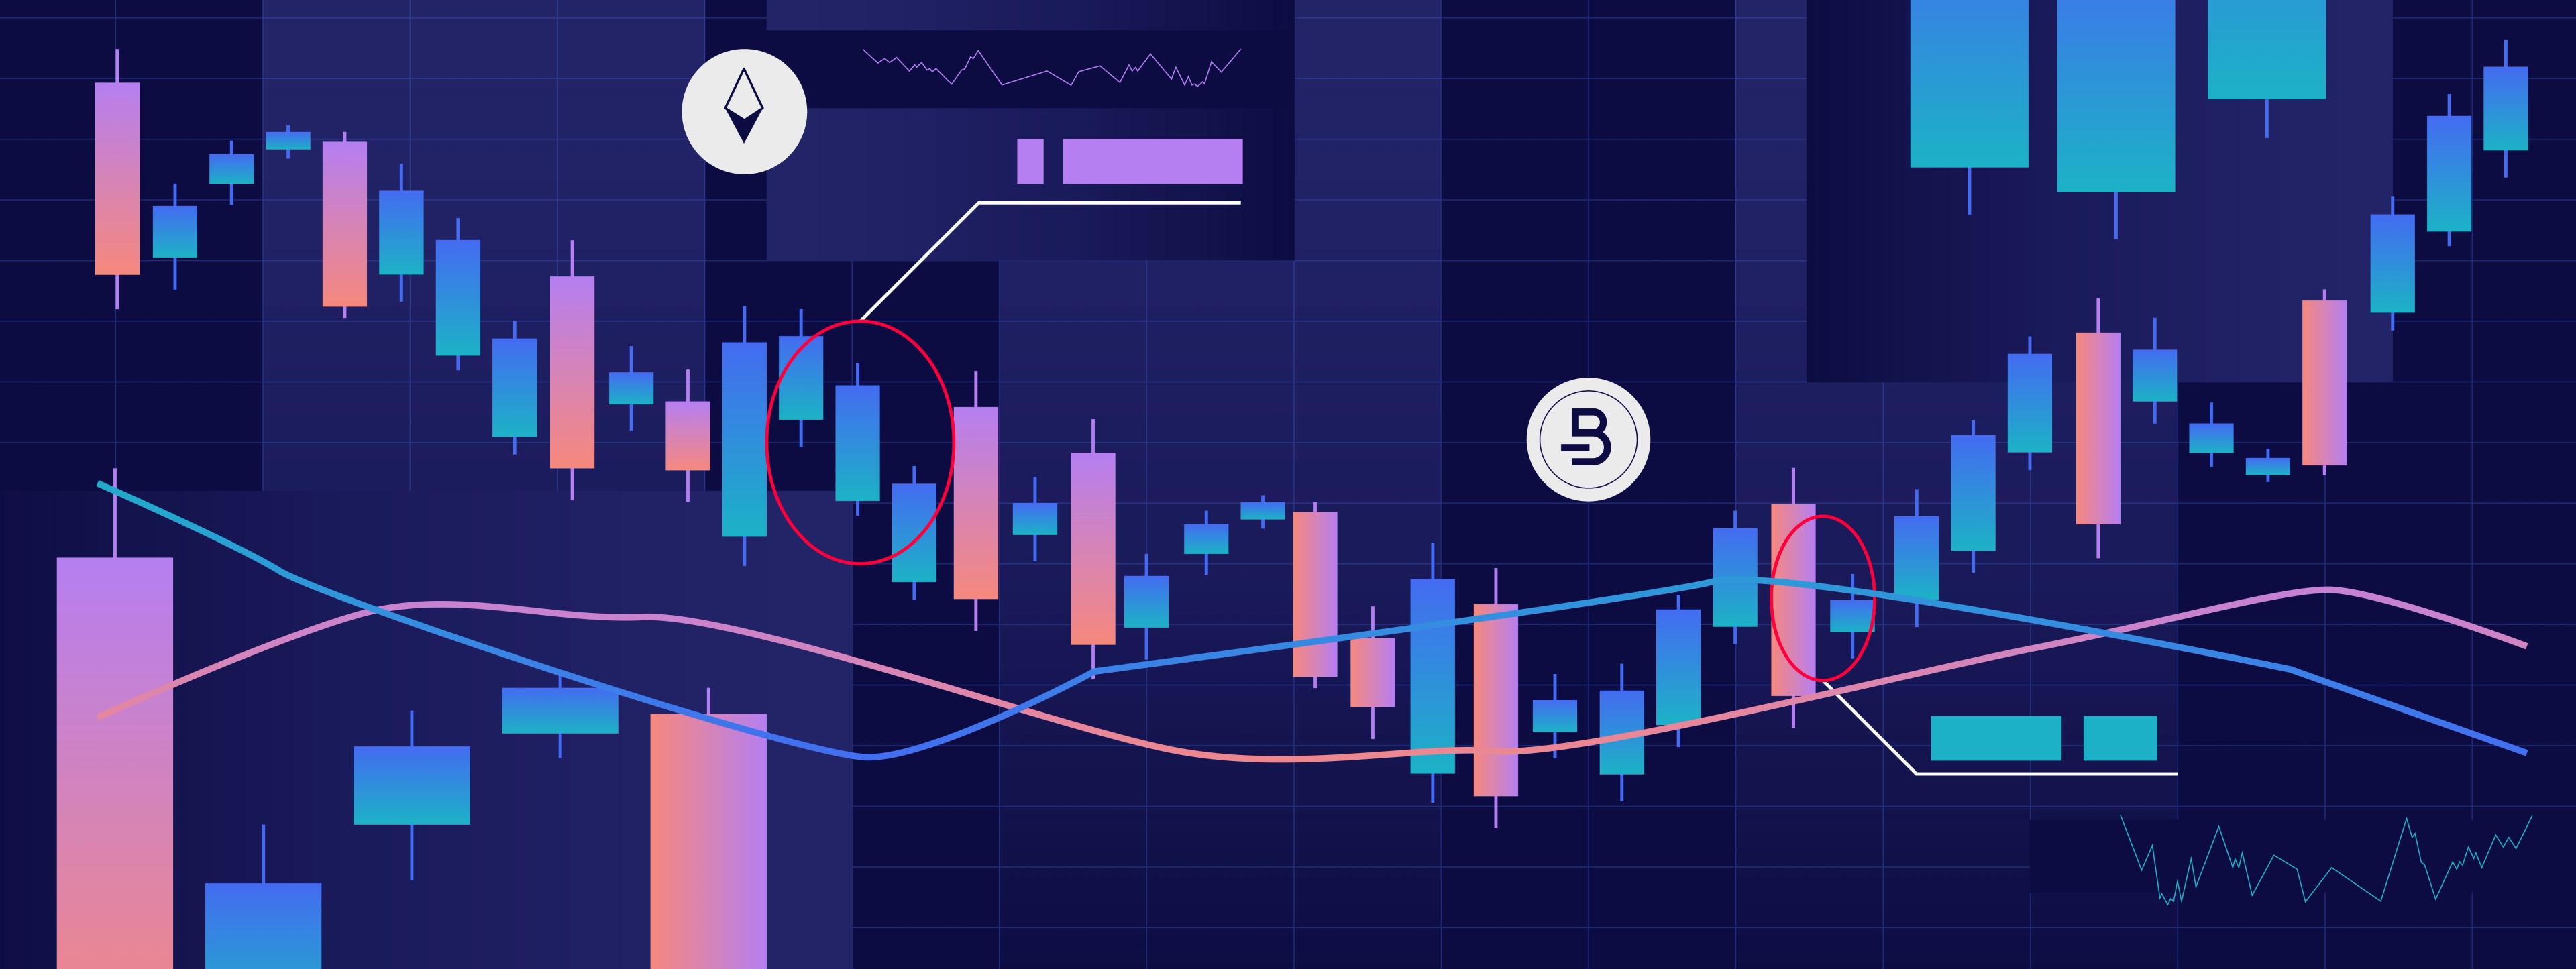
#trading risk#Exponential Moving Average#Kaufman’s Adaptive Moving Average+2 plus de tags
Crypto trading 101: What are Moving Averages (MA)
Support and resistance levels are critical tools in trading, helping investors predict market movements and make strategic decisions about asset prices.
#Bull market#technical indicators#support and resistance+2 plus de tags
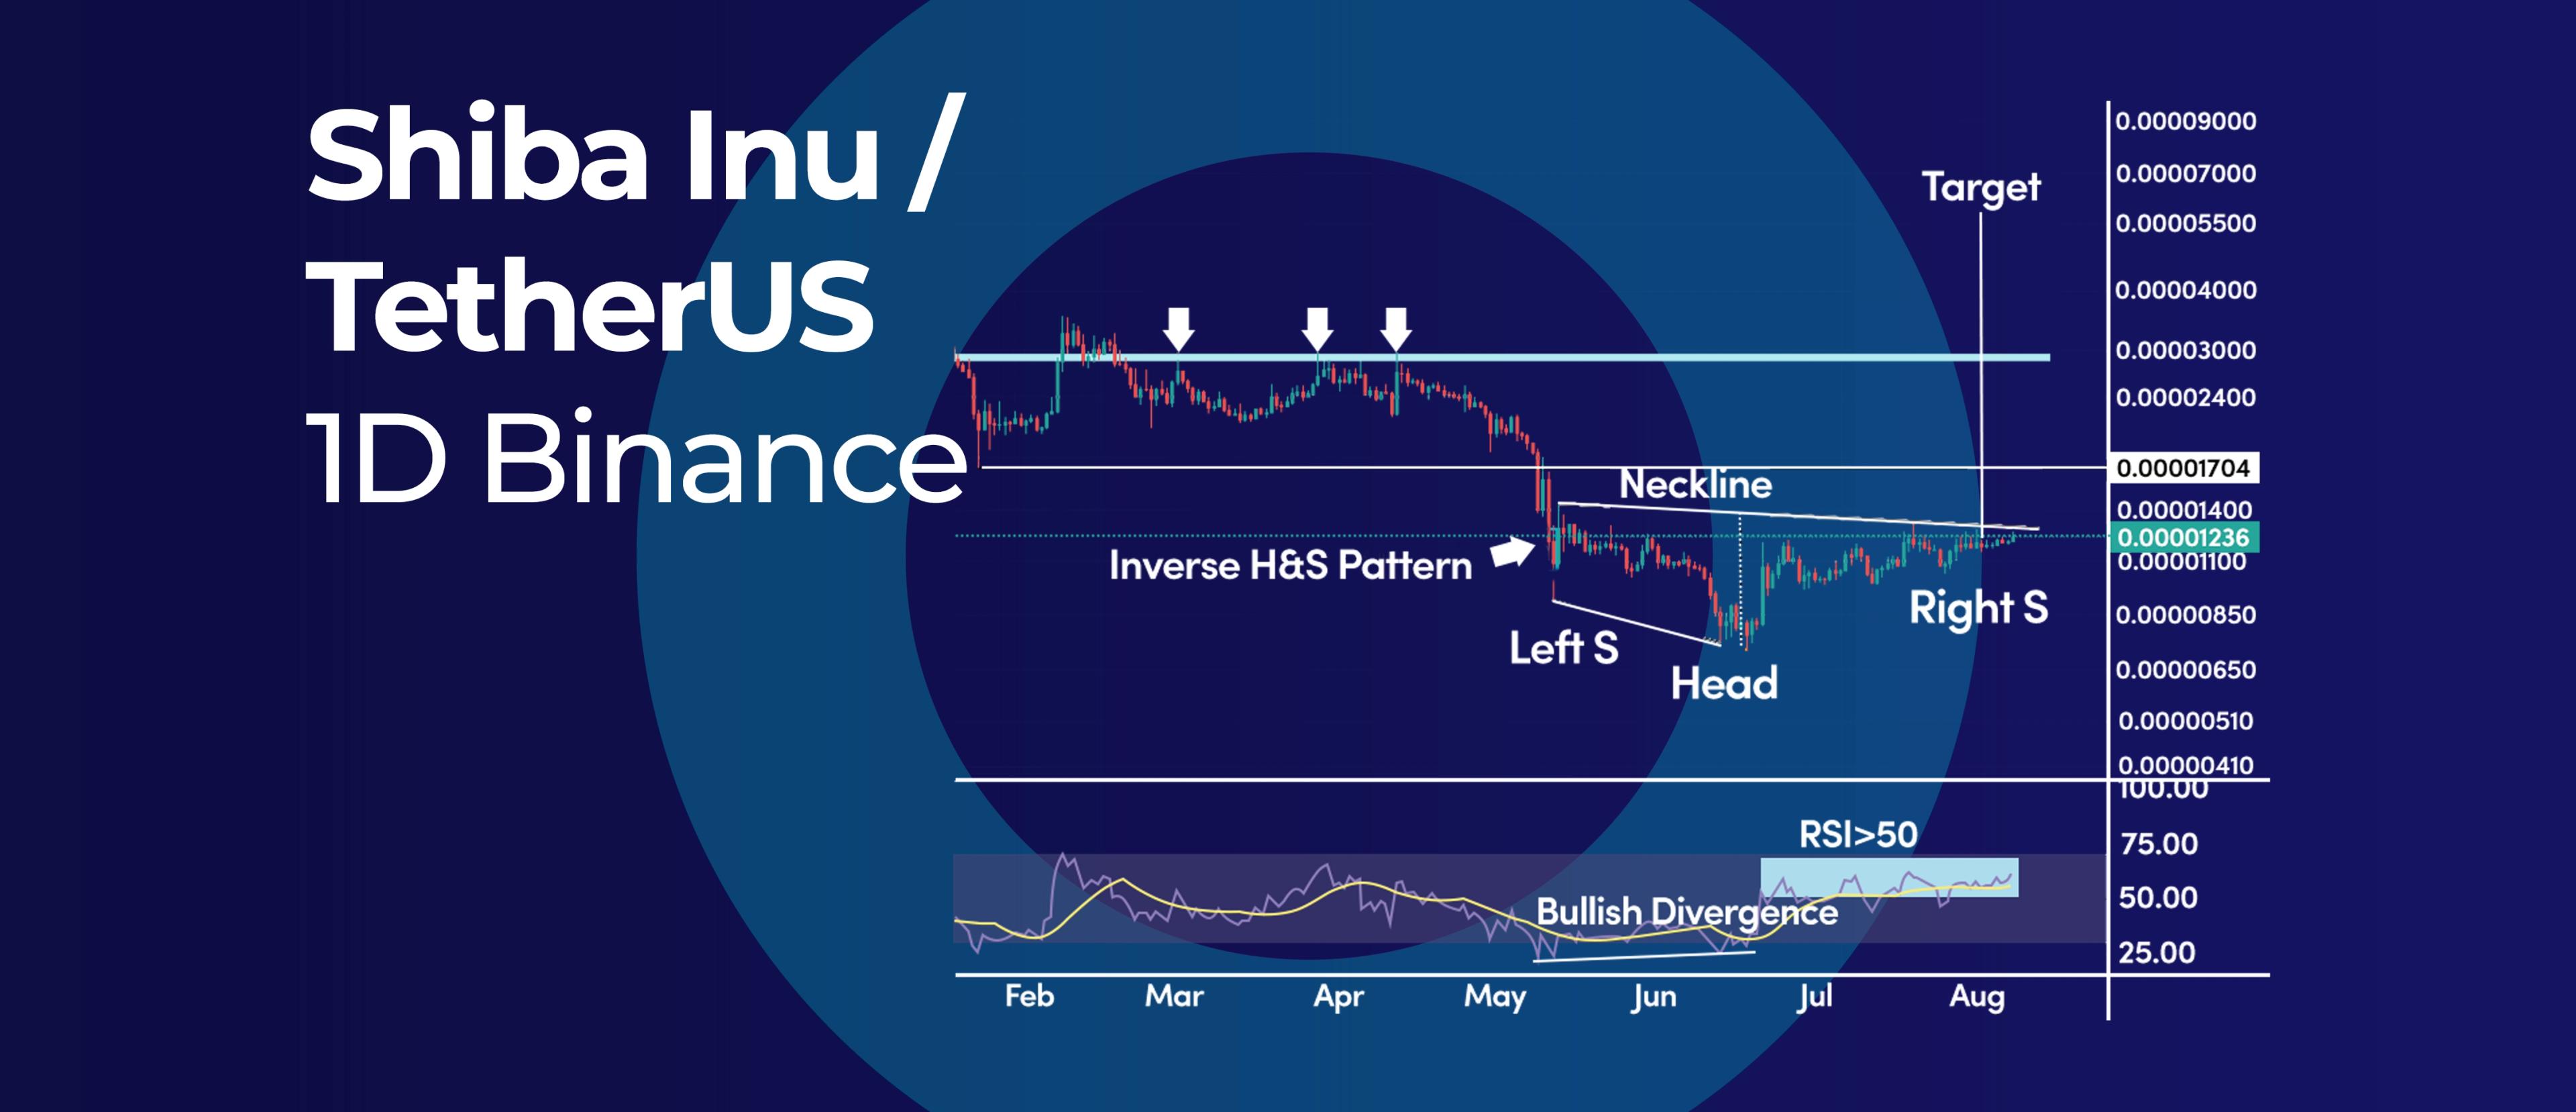
Shiba Inu Inverse Head and Shoulder Pattern Calls for a Rally
8 août 2022 • 2 min de lecture
#Bitcoin#Cryptocurrency#Official partnership+2 plus de tags
Crypto.com Alpha Navigator Quest for the month August
5 août 2022 • 5 min de lecture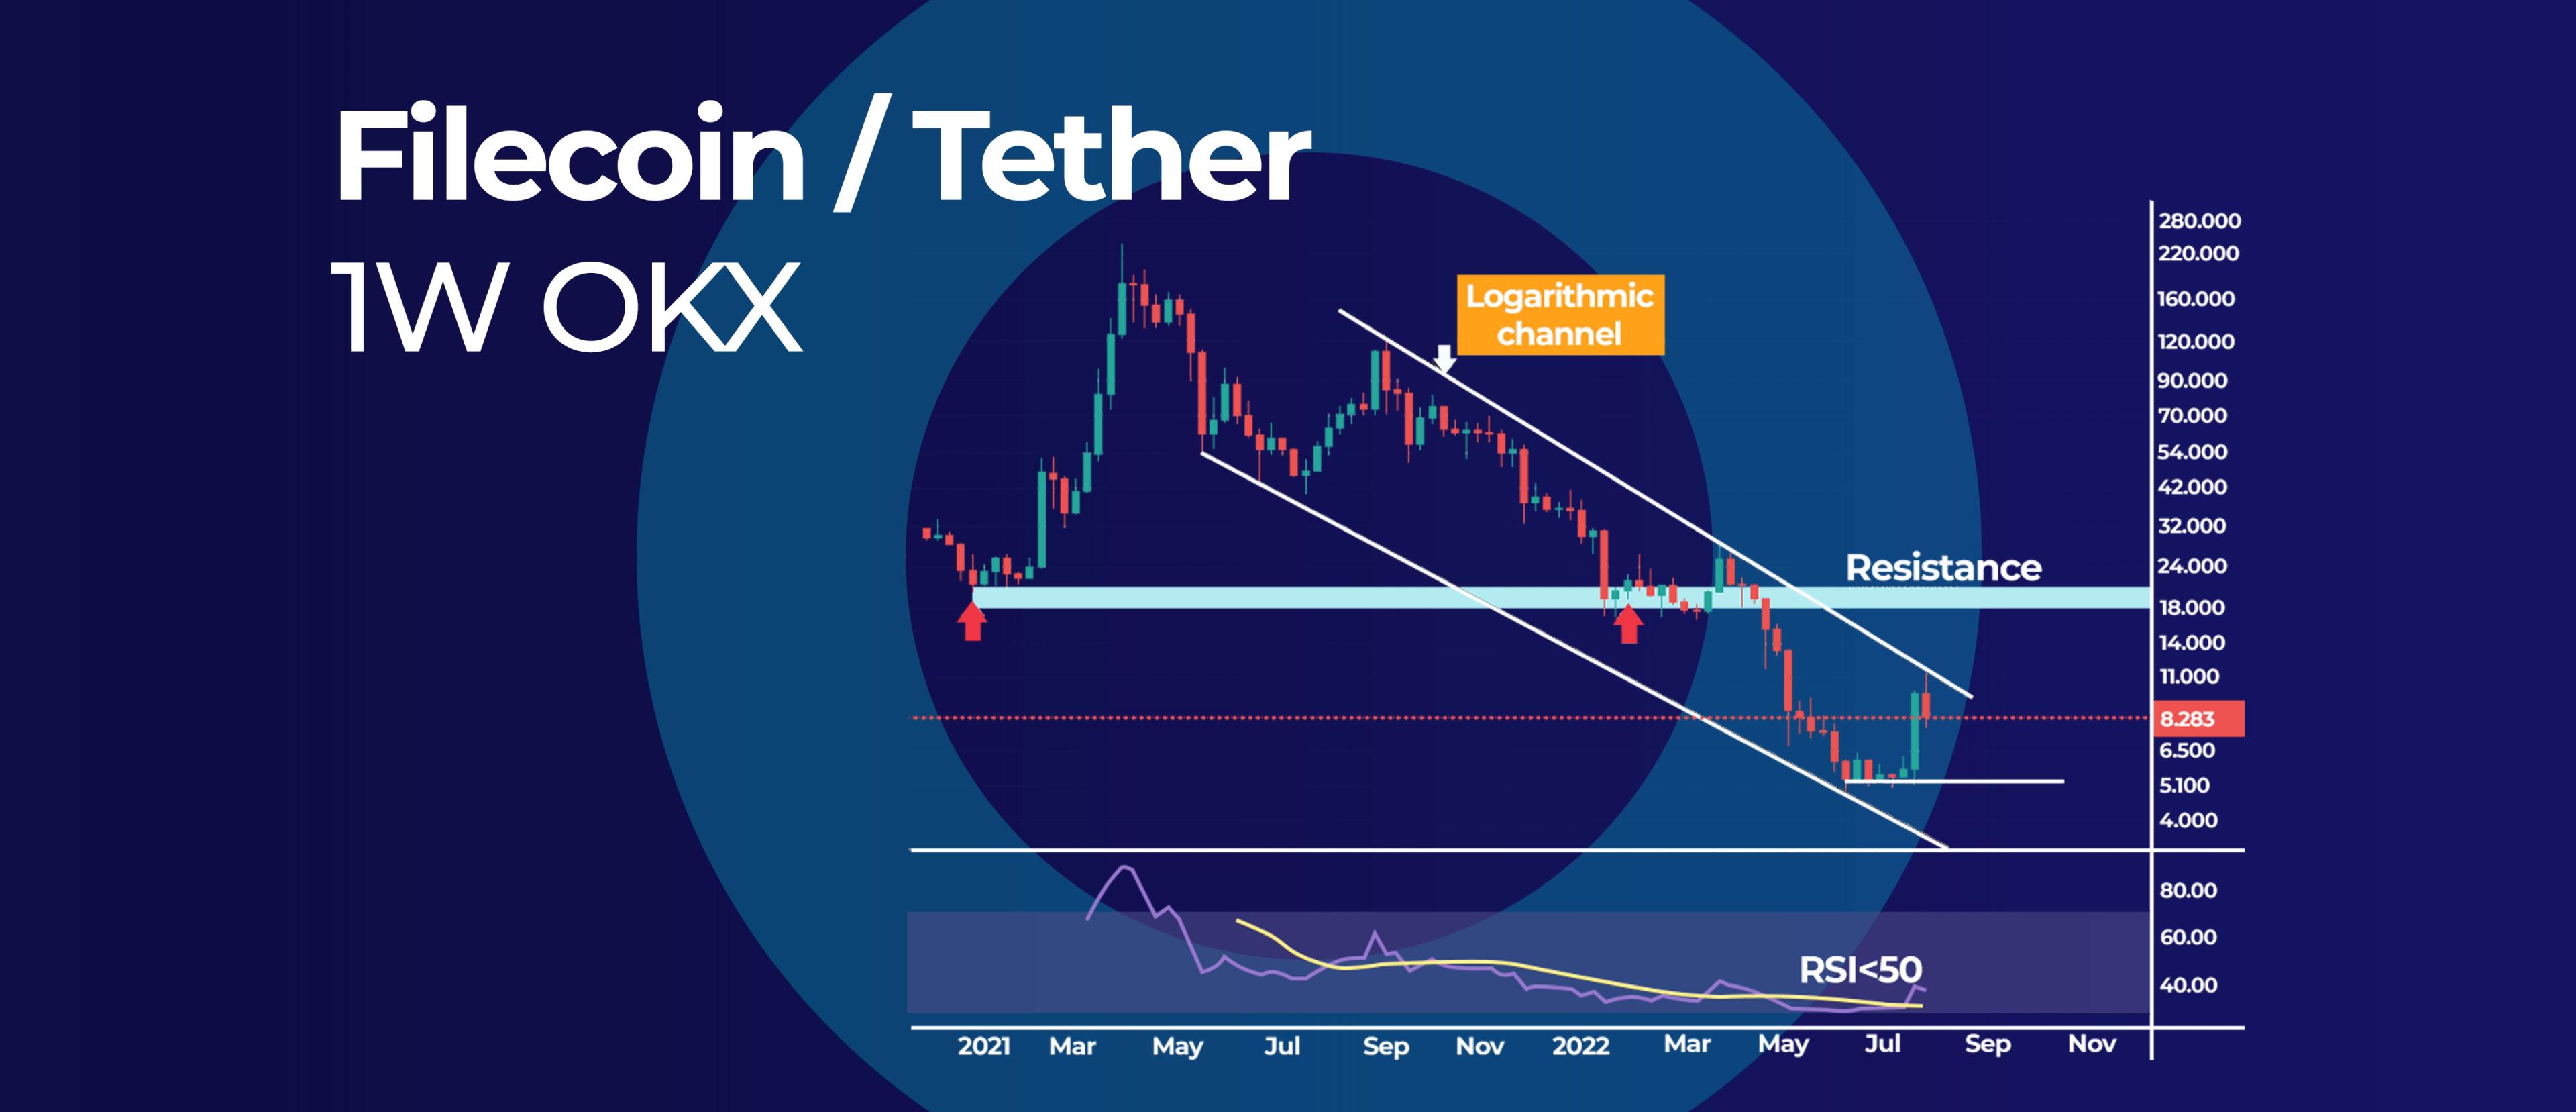
#Cryptocurrency#crypto trading tips#support and resistance+2 plus de tags
Filecoin Logarithmic Channel Caps Gain at $11
5 août 2022 • 2 min de lecture
#Stop-loss#crypto trading tips#Bot trading+2 plus de tags
How to take advantage of Crypto Psychological Numbers and how to use them
4 août 2022 • 3 min de lecture

Conseils de trading
Cryptocurrencies | BTC vs. USDT As Quote Currency
12 mars 2019 • 4 min de lectureBot Trading 101 | The 9 Best Trading Bot Tips
17 déc. 2019 • 8 min de lectureTechnical Analysis 101 | The Best Momentum Indicators
31 janv. 2019 • 7 min de lectureType of Trader vs Type of Settings
4 avr. 2019 • 8 min de lecture

_webp.webp&w=3840&q=75)