Incident Post Mortem: January 6–7, 2021
_*This article has been updated with a full post mortem.
_Last week, on January 6th and 7th, Coinbase experienced a critical outage which impacted the APIs used to serve coinbase.com and our mobile apps. Trading on our Exchange via the APIs, and underlying market health was unaffected. This post is a deep dive on what caused the downtime, how it was remediated and steps we’re taking to prevent similar outages.
A tale of two storms
January 6th
At 10:15am EST, automated alerts due to elevated API error rates fired on several of our monitoring channels and we spun up our incident response procedure to investigate the issue. It was immediately clear from our monitoring dashboards that one of our MongoDB clusters was experiencing high latency when queried, and in addition to timing out requests, was causing a backup of our web workers which were queuing, waiting for queries to return from the database.
Based on available metrics, we decided to trigger a failover of the cluster to allow a healthy server to replace the unhealthy primary, and we initiated the failover with the assistance of our MongoDB support operations team. In tandem, we manually throttled our application server’s connections to the cluster, preventing it from attempting new queries. This restored functionality to APIs that did not depend on the specific cluster by allowing web workers to ‘fail fast’. After the cluster failed over to new hardware, the cluster regained nominal functionality and was able to serve queries without latency, at 11:26am EST we removed the application’s manual throttling to the cluster.
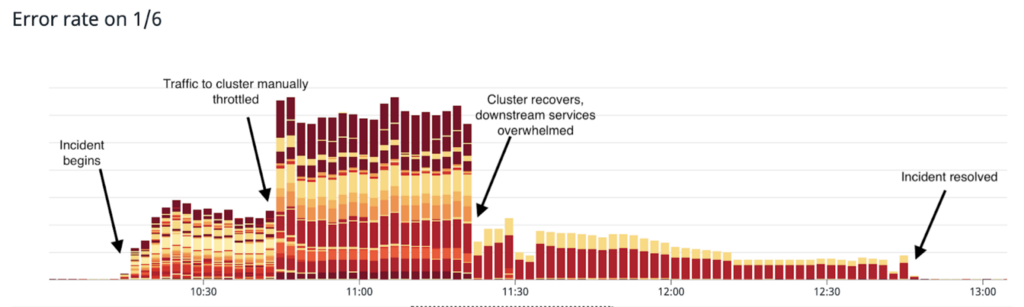
While this restored the majority of functionality, the return of web request throughput, combined with record high traffic due to crypto price movement, created a thundering herd of requests to services downstream of our application server. Several of our downstream services were hit with traffic that they were underprovisioned for (they had in fact autoscaled down based on the blockage in upstream traffic), and client retry behavior on the application server compounded the issue, rapidly issuing retry requests to the services. This retry storm prevented some parts of our app from functioning. Notably, critical functionality of buying/selling/trading cryptocurrency was functional during this time.
In order to restore full functionality to our API, we split into several work teams and strengthened the downstream services by employing a similar pattern: throttling traffic, provisioning more powerful or more plentiful hardware for the services as needed, and throttling traffic back on. Full functionality was restored at 12:46pm EST.
We began investigation into the initial cause of the unhealthy MongoDB cluster alongside the MongoDB team, which initially pointed to a hardware issue, due to the fact that a failover to new hardware had resolved the issue.
January 7th (groundhog day comes early)
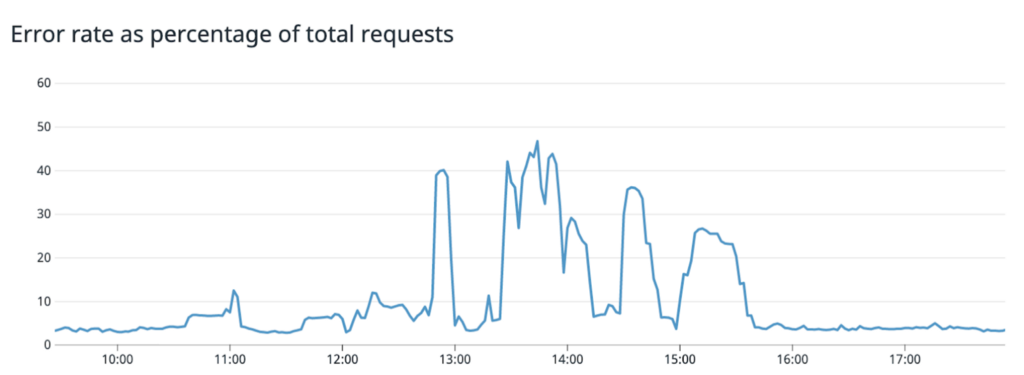
The next morning, we were hit by a similar issue, but much more severe. Coinciding with record traffic, from 10:32am EST until 3:36pm EST, several of our MongoDB clusters experienced the same pathology — slow queries leading to errors and exhaustion of web workers at our application layer. We immediately spun up an incident response team and initiated the same remedy that had cured the issue just 24 hours before: trigger a failover on the unhealthy MongoDB cluster. However, while the failovers would momentarily return the clusters to a healthy state, the clusters would regress to unhealthy status within 10 minutes. Users would have a functional app for short durations, but weren’t able to reliably use the app depending on when they logged on or tried.
Our initial hypothesis of hardware failure did not line up with the symptoms observed, so we initiated a deep and urgent investigation with our MongoDB technical support team to understand why several clusters were all exhibiting the same problematic behavior.
To understand the root cause, we should take a diversion to briefly explain the topology of our application and MongoDB services.
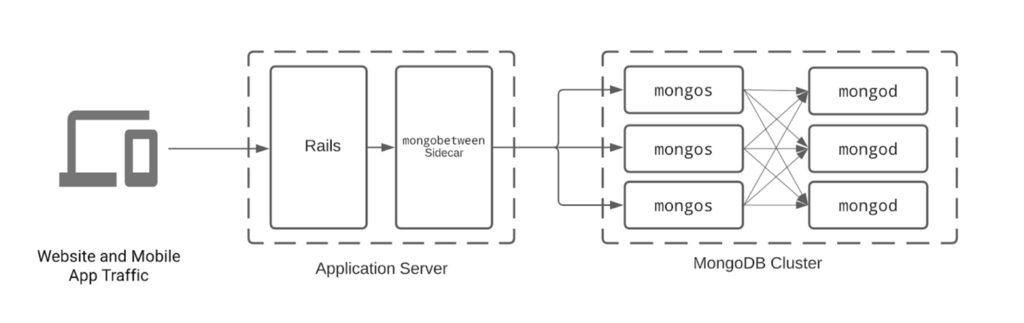
Request flow from user to data. Mongobetween serves as a connection pool for our application server, mongos routers are responsible for mongod server selection based on request read/write preferences.
We use a sharded MongoDB setup to increase availability (how fast and reliable data is) and scalability (how much data we can hold and serve at once). In order to route queries to the correct mongod shard, mongos sits in between our application server and the database process. In order to keep quick connectivity, our Rails application server holds connections to mongos via our mongobetween connection pooler, and in turn mongos holds a connection pool to the mongods. During regular operation, mongobetween and mongos will bring their active connection count up or down depending on traffic.
Given this understanding, we can explain the root cause of the issue and how we remediated it to restore service to our apps.
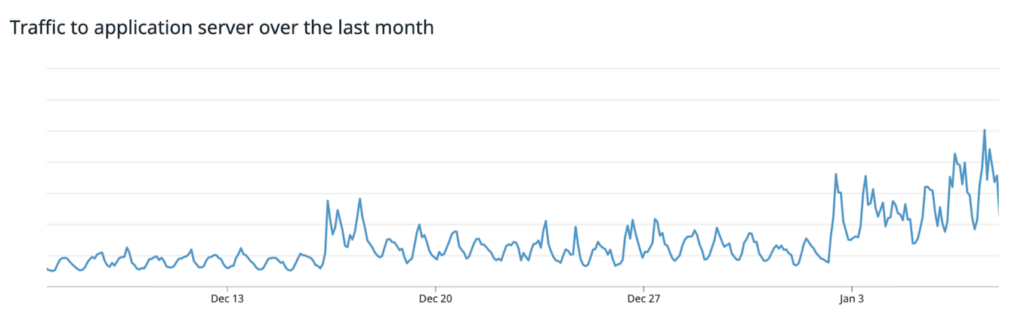
On January 7th, we had the highest traffic our apps had ever received, easily 6xing what had already been an elevated steady-state request rate. Due to the sheer volume of traffic, even optimized queries to our mongods (which back the majority of critical data on Coinbase) were unable to stay highly available. Requests for the data were so voluminous that they began to queue up at the mongos-mongod layer. In response to not getting the queries back in time, mongos responded by spinning up more connections to the mongods for its connection pool. These new connections further taxed the mongods available resources and led to even more queued requests, which led to more connections spawning, which led to queued requests, over and over until the clusters became completely unavailable. We had seen retry storms at our application layer the day previously- now mongos was connection-storming its own mongods.
Once this was discovered, in order to remediate it we needed to prevent mongos creating more connections to mongod than mongod can concurrently serve given our load profile.
We changed our MongoDB configuration cluster by cluster, and set ShardingTaskExecutorPoolMaxSize to an appropriate value for each cluster. This had the desired effect. After the clusters were restarted with the new setting, they remained online even under the heightened load.
By 3:36pm EST, we had applied the setting to all clusters, and had fully restored service. Luckily, due to the previous day’s remediations, we were not hit by retry-storms on our own services when we brought back healthy web traffic.
We’d like to call out that resolution of this incident would not have been possible without the heroic support and dedication of our MongoDB technical support team.
Looking Ahead
Needless to say, such extended and severe downtime during some of the most critical moments for our users is unacceptable, and we are pursuing multiple avenues to increase the availability of our services in preparation for heightened load and possible (unknown) future failure modes of our infrastructure.
First, we are further decomposing our monolithic application server into separate discrete services. This will allow us to have different scaling profiles for different sections of our API surface that receive heterogeneous load. In addition, this will reduce the blast radius if we have issues in any one surface, as it will only affect the APIs or functionality that it is responsible for.
Second, some of the most problematic MongoDB clusters during the downtime were ones that held large discrete miscellaneous collections. We are breaking out the individual collections from these clusters and moving them onto their own separate clusters. This will similarly reduce the blast radius of any single issue in one of our MongoDB clusters. In 2017 we broke our single MongoDB database from one giant cluster into three, in an incident mitigation resulting from the previous crypto bull run.
In addition, we continue to reduce load on MongoDB through caching and moving certain queries to analytics nodes if they do not have strong consistency requirements.
We take the uptime and performance of our infrastructure very seriously, and we’re working hard to support the millions of customers that choose Coinbase to manage their cryptocurrency. If you’re interested in solving scaling challenges like those presented here, come work with us.
was originally published in The Coinbase Blog on Medium, where people are continuing the conversation by highlighting and responding to this story.