The 7 Most Common Candlestick Patterns
Candlestick patterns are a very powerful tool for every trader. They are used to determine potential directions of the price, and often are included in strategies to reinforce buy and sell points.
They were introduced in the 18th century when a Japanese merchant developed the candlestick chart. They compile information about the open, high, low and close (OHLC) of the price in a period of time, and can be very powerful in trading.
When these charts became more famous and widely accepted, traders realized that the price was executing very specific behaviours and repeated patterns over time. Usually, anticipating similar price movements. Something that sparked the curiosity of every investor, to the point where it has become a totally new field of study in trading.
Nowadays, almost every professional trader uses candlestick patterns to a greater or lesser extent. Whether they are used to analyze the likelihood of a trend reversal or to actually open positions based purely on patterns, they have become a powerful tool in trading to implement technical analysis along with support, resistances and technical indicators.
Some of the most widely used candlestick patterns in trading are the following:
Hammers
A hammer is a bullish reversal pattern. It normally appears during downward trends and is represented by a candle with a long lower wick and short body at the top.
This pattern suggests that the demand has strongly rejected the price when it was going down, therefore, forming a long lower wick. And, since the demand is present in that specific area, it can be interpreted as a trend reversal sign and is often understand as a buy signal.
Inverted hammer
The inverted hammer has the same logic, but during upward trends, therefore being a bearish reversal pattern.
It is represented during an upwards trend and as a candle with a long upper wick and a short body at the bottom. It can be used in your trading strategy to close a position or open a short position.
Engulfing pattern
It is a reversal pattern that can be bearish or bullish, and is represented by two candles. The second candle totally engulfs the first one. If this happens during a downtrend, the price is likely to reverse back up. For upward trends, the price would have a bearish reversal.
Evening star
An Evening Star is a bearish reversal pattern represented by three candles. During an uptrend, a long increasing candle is followed by small-bodied candle still increasing. The third candle decreases, has a long body and closes below the midpoint of the first candle. 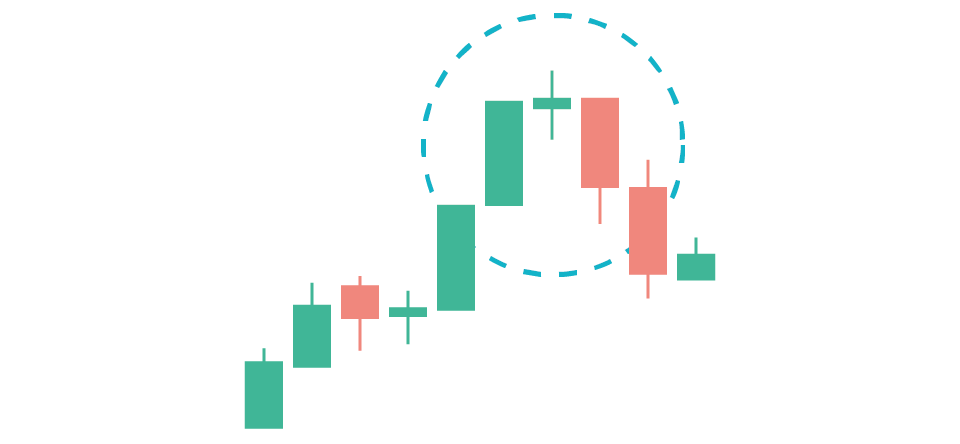
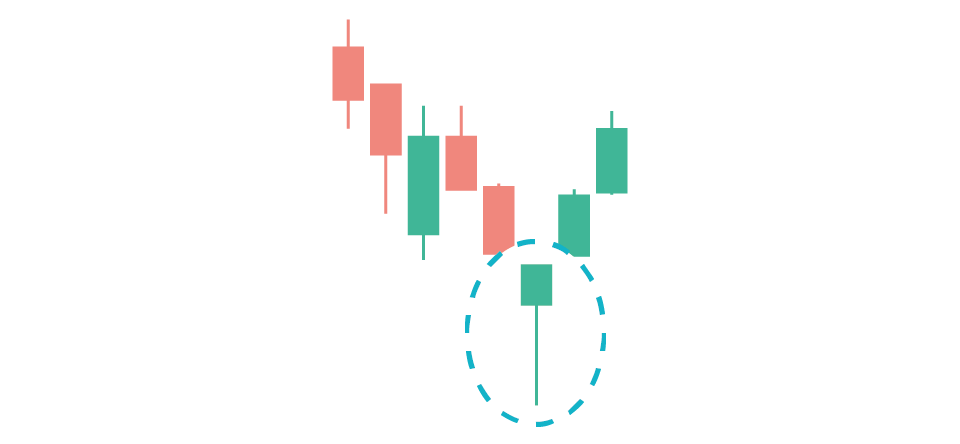
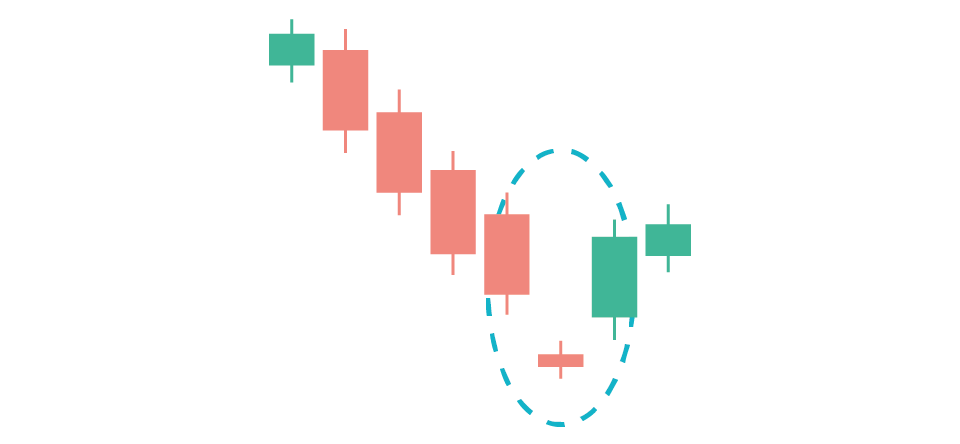
Morning star
When a Morning star is spotted, a bearish trend is more likely to reverse. Many traders interpret it as a way to reinforce their buy points. If a strategy signals a buy and the price performs this pattern, the trend is likely to reverse back up.
Morning Star is a bullish reversal pattern represented by 3 candles. During a downtrend, the first candle is a long decreasing candle. The second one is the so-called “star” which has closing below the previous low. The third candle is a long increasing candle closing above the midpoint of the first candle.
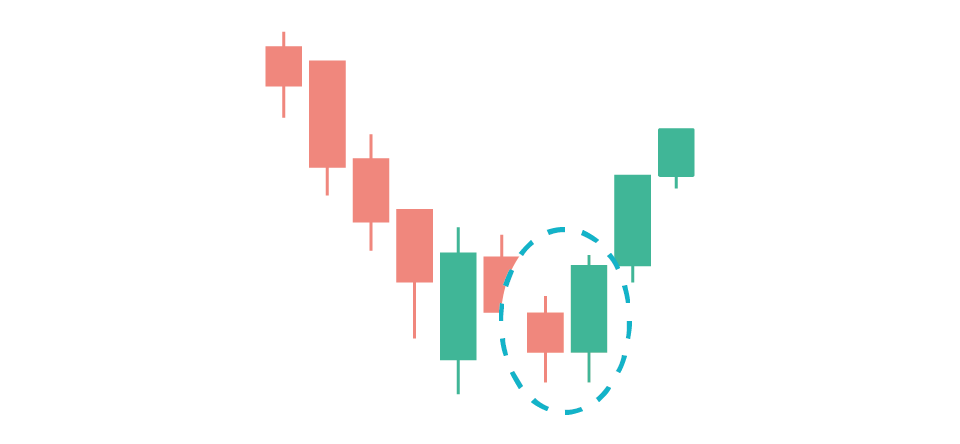
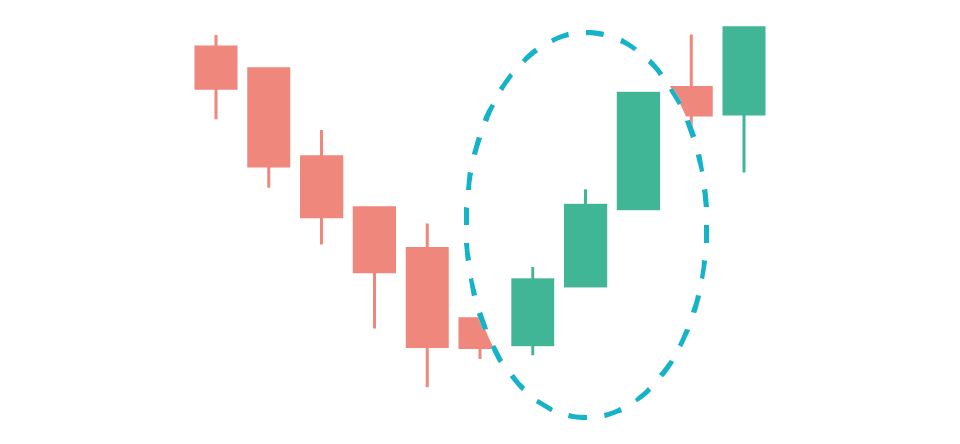
Three advancing white soldiers
As the name suggests, three candles advance upwards during a downtrend. This pattern has bullish potential and is commonly used to pinpoint trend reversals.
Three Advancing White Soldiers is a bullish reversal pattern represented by three candles. After a downward trend, every candle has a long body and an upward direction.
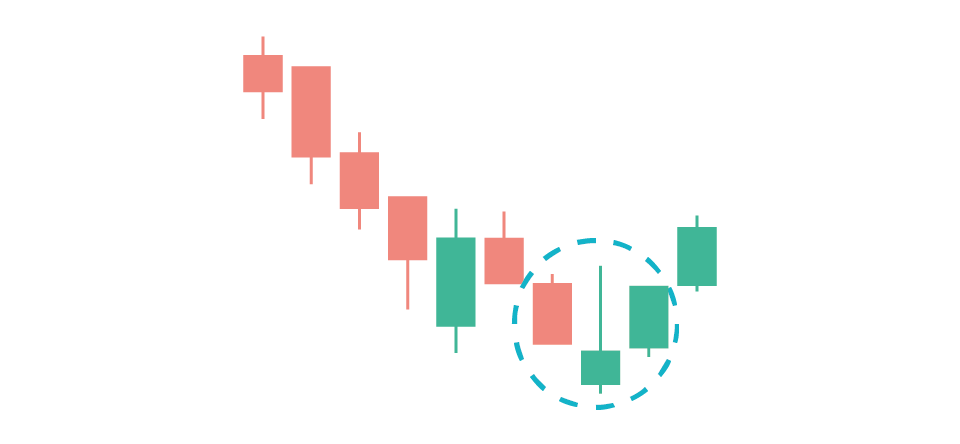
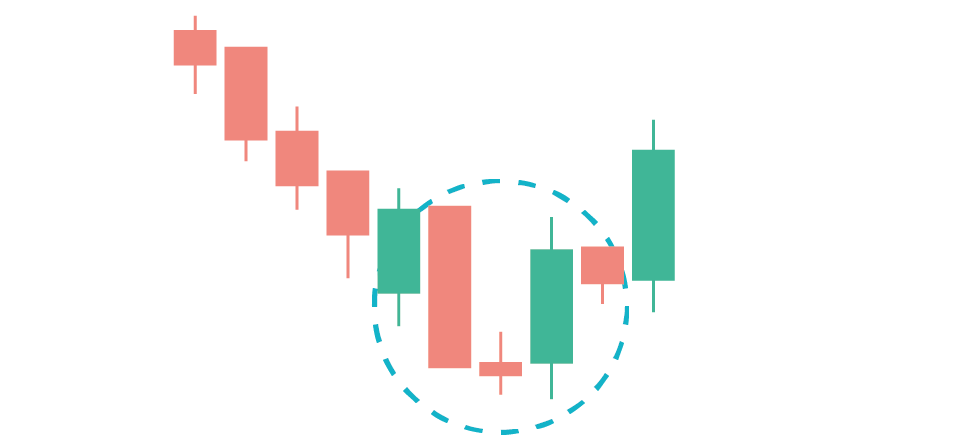
Abandoned Baby
It can be a bullish or bearish reversal pattern and is represented by three candles. Regarding the bullish pattern, the first candle has a long body and downward movement. The market gaps on the next candle, which is a Doji, followed by a candle with long body and an upward movement. Then, suggesting that the price is very likely to reverse since the bulls have driven the price up very quickly.
These patterns do not necessarily indicate what is going to be the future direction of the price. However, they give very valuable information about the future direction of the price and can formed a very combination with other tools such as indicators, supports and resistances.
Add any of these famous candlestick patterns to your trading strategy and let it run automatically 24/7. Only with Cryptohopper!


_webp.webp&w=3840&q=75)
_webp.webp&w=3840&q=75)


