The Bitcoin halving
With the halving only a few hours away, it is only right that we give some thought on the most critical event in the Crypto space!
All crypto traders and holders have been eagerly waiting for the next big bull run and, therefore, the next halving! The third halving is just a breath away on the 12th of May, and many expect the bull run to intensify even further after that period!
Discounts:
You can celebrate the halving at Cryptohopper by using the BITCOINHALVING code and get 25% off your first invoice for each subscription type.
Therefore if you buy the yearly subscription, you will have 25% off for the rest of the year! The code is only valid until Thursday the 14th of May, so up hurry to get those discounts rolling!
So what happens during the halving? This is what we are going to answer in the next section.
What is Bitcoin Halving?
The halving consists of a reduction in the newly mined supply of Bitcoin. Currently, 1,800 new Bitcoins are generated daily. The halving will cut this amount in half; therefore only 900 BTC will be generated daily until the 4th halving. In block terms, the number of Bitcoins generated in every block will be reduced from the current 12.5 to 6.25. The yearly inflation rate will drop from 3.64% to 1.8%. Additional data and statistics of the halving can be found here: Bitcoinblockhalf.com.
One of the most basic laws of economics states, that as supply decreases, price increases. However, considering that over 87% of the total supply of Bitcoin is already in circulations there are those who doubt that a further reduction in supply now will have a great impact on the price.
Many Crypto enthusiasts and traders still believe that this halving will have a similar effect on the price of Bitcoin as the last halving, as Bitcoin is highly cyclical. We will now examine the other two halvings and their effects on the asset’s price!
Past Halvings
First Halving
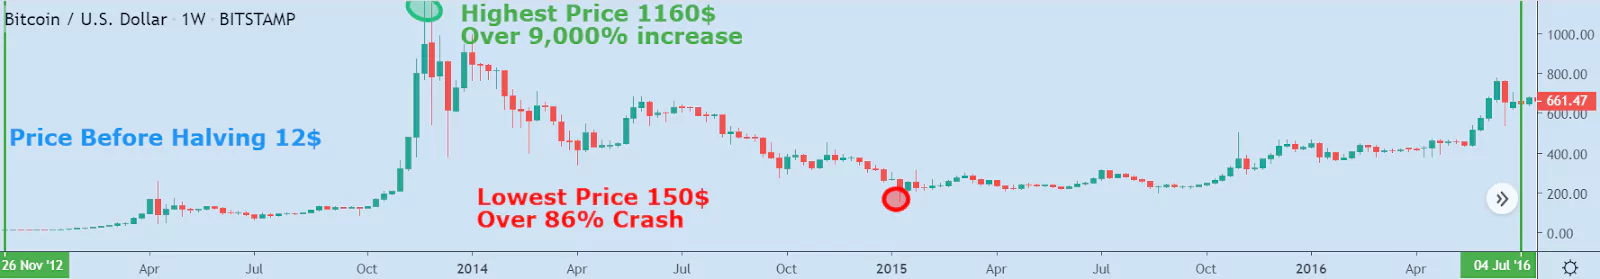
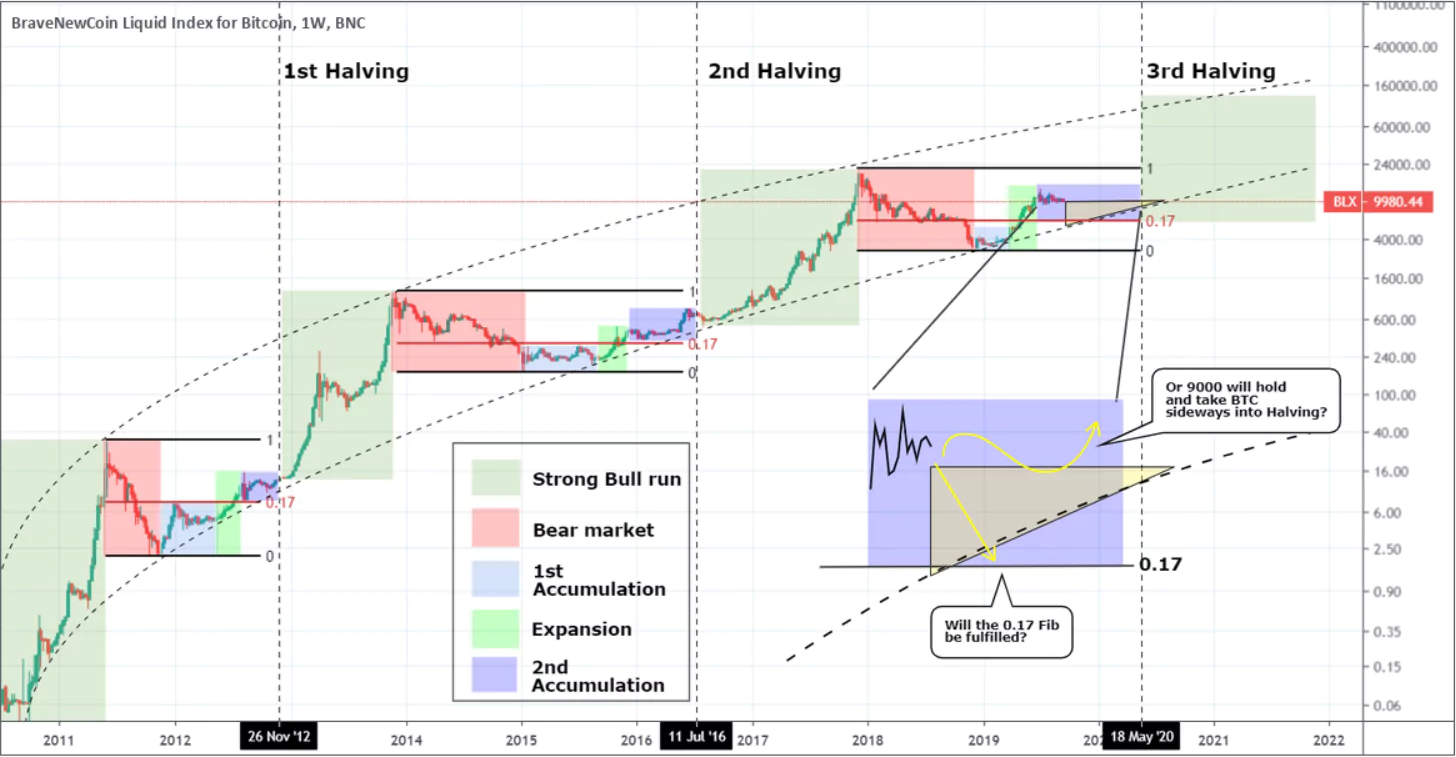
The first Bitcoin halving occurred on November 25th, 2012. The price of Bitcoin prior to the halving was only 12$. After the halving, the price increased by more than 9,000% to 1,160$ in about 370 days. This was followed by an 86% market crash over the course of 420 days. After a long period of consolidation of about 300 days, the price started to increase again before the next halving.
Let's now take a look and see how similar or different the price behaved during the second halving.
Second Halving
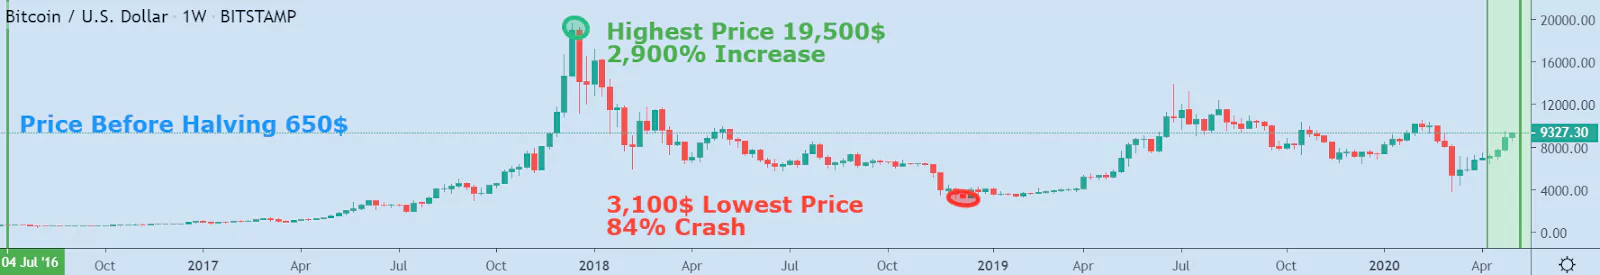
The second Bitcoin halving occurred on July 9th, 2016. The price of Bitcoin before the halving was only 650$, which is half from the previous all-time high. After the halving, the price increased by almost 3,000% (only a third compared to the first halving), reaching 19,500$ in about 525 days.
This was followed by an 84% market crash over 364 days. After a shorter period of consolidation of just over 100 days, the price started to increase again before the next halving. Sounds similar? Well, that’s because it is. The price followed an almost exact pattern from the first halving.
We will now move on to our predictions of the third halving based on the data gathered from the previous two.
Third Halving Predictions
The third halving is set to occur on May the 12th. If the third halving will follow the trend set by the other two exactly: then the price of Bitcoin right now should be around 9,000$-10,000$ at the time of the halving.
Afterward, the price should increase by about 1,000% if it is to follow the pattern of increasing 3 times less than the previous halving. If the previous statements turn out to be true, then we could expect BTC to peak around 90,000$-100,000$ following the third halving.
Based on the past data it could take Bitcoin as little as 1 year and as long as 2 years to reach this peak. The price should then follow a correction of around 80% down to 20,000$.
Summary:
Expected price around the time of the third halving: 9,000$-10,000$
Expected peak after the third halving: 90,000$-100,000$
Expected price at the bottom of the correction: 20,000$
These are of course our expectations based solely on how the price behaved over the previous 2 halvings. The price won’t necessarily occur following the exact steps we displayed here. As with technical analysis in general: the price tends to follow historical patterns but it doesn’t have to.
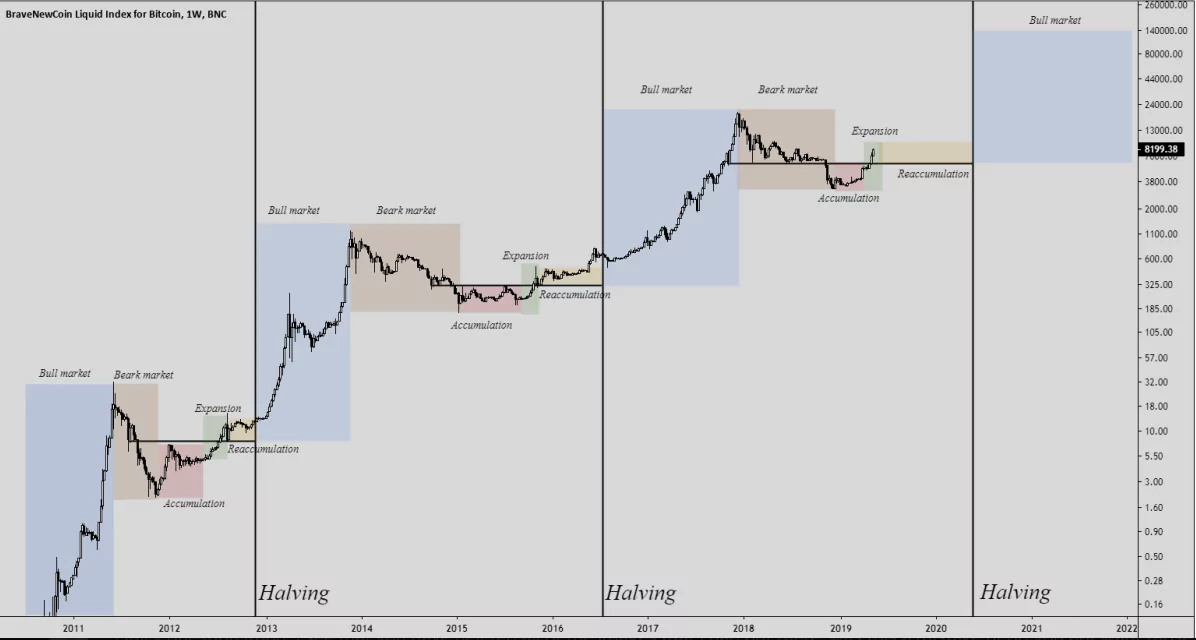
The graphs below provide a visual representation of what other traders expect to happen during the halving!
Conclusions
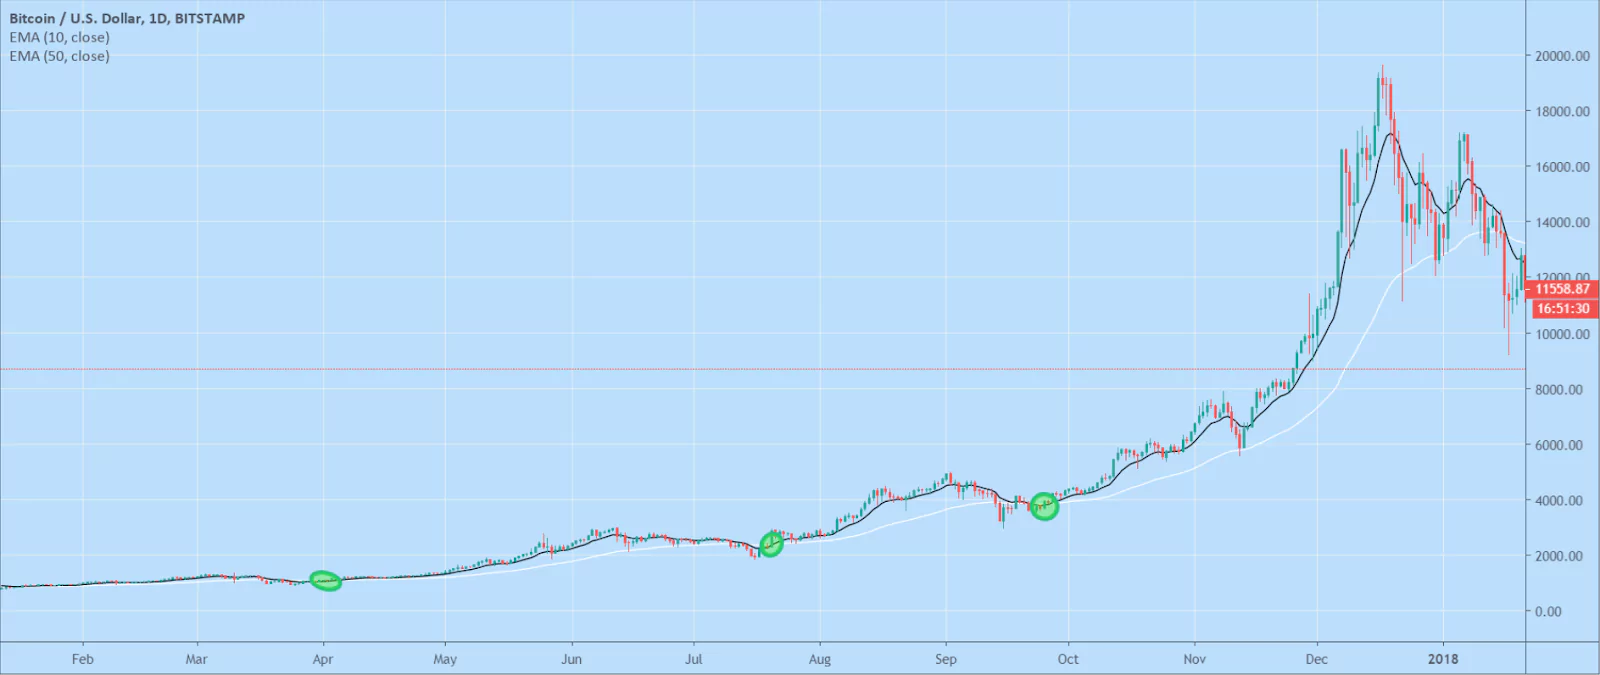
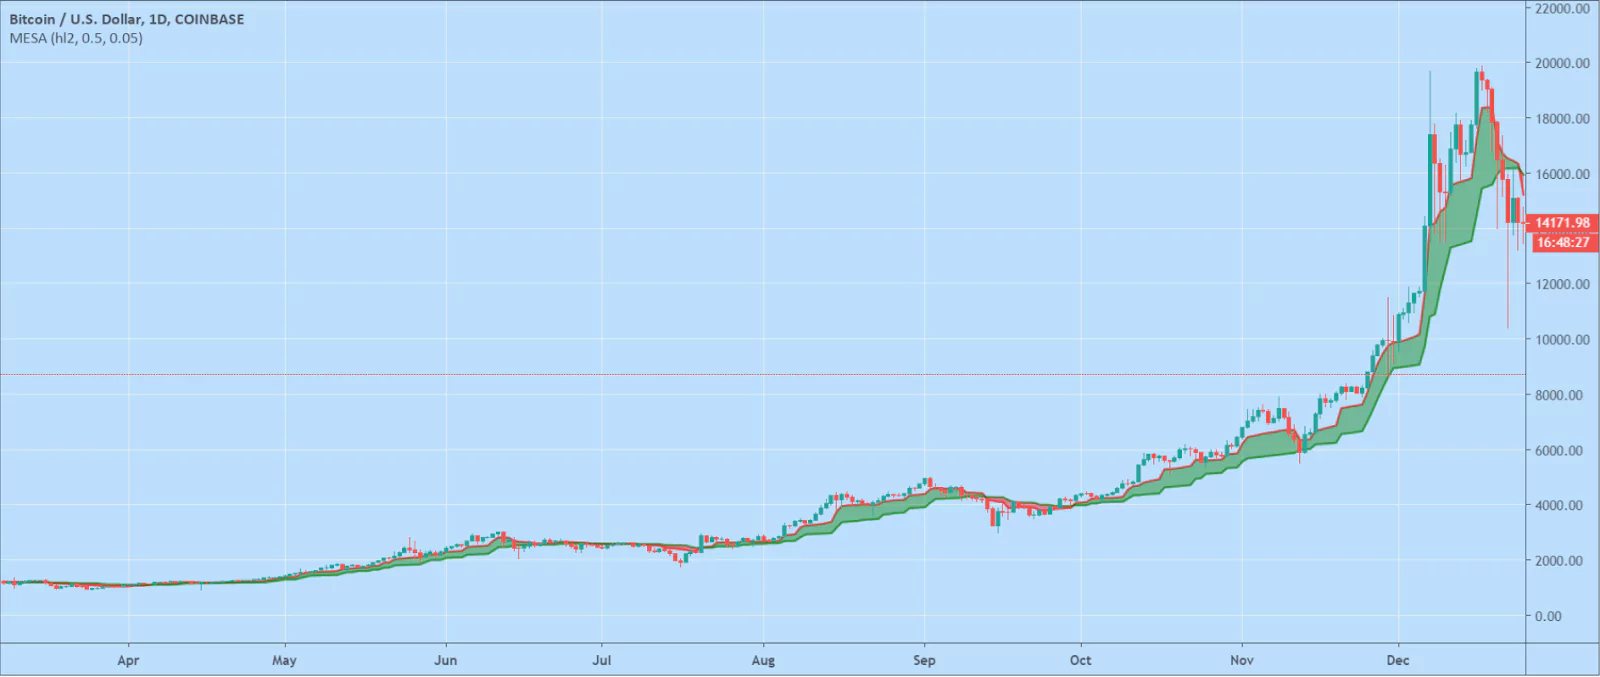
If the price will behave similarly to the first two halvings, then trend-following indicators will be very useful in identifying the trend and riding to the moon. We will now give some examples of trend-following indicators you can use for swing trading the halving:
Crossover of the 10 and 50 EMA (Daily chart)
MESA (Daily chart)
Ichimoku Cloud (Daily chart)
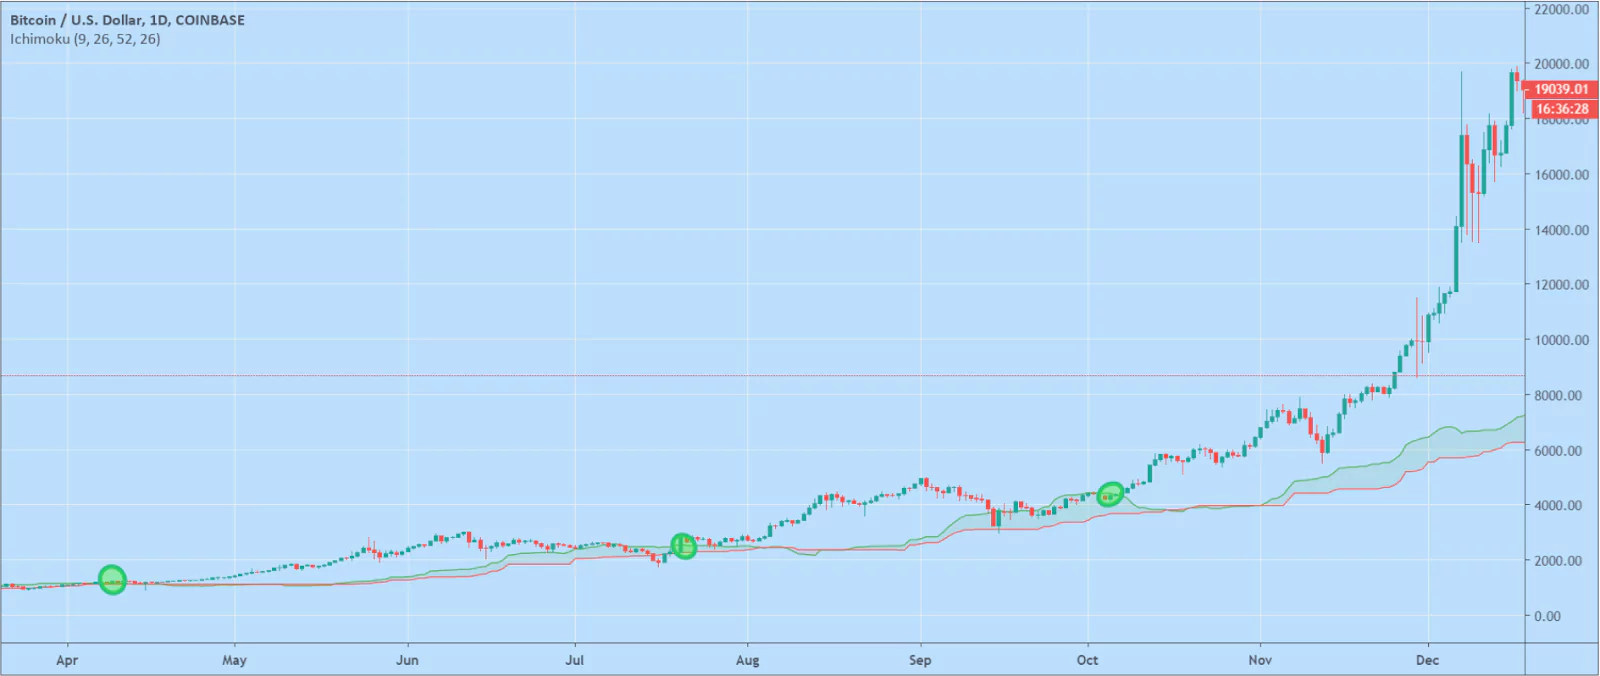
All of the indicators mentioned above are available through Cryptohopper along with many more. Join us on Cryptohopper today and take advantage of the next halving by automating your trading!


_webp.webp&w=3840&q=75)
_webp.webp&w=3840&q=75)


