The Outage
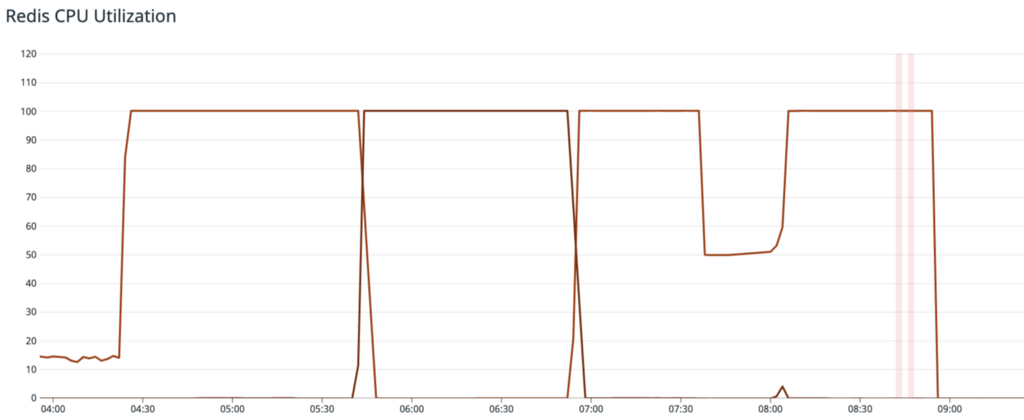
A group of oncall engineers convened after being paged for high error rates across many endpoints. It was quickly diagnosed as an issue with a Redis cluster used to store spot rates for currency conversions. These spot rates are used for estimated conversions between currencies, which puts it in the critical path for a range of functionality such as displaying the value of your portfolio in your local currency. The CPU load on this Redis cluster suddenly hit 100% and was causing several API endpoints and background jobs to fail. We immediately moved to reduce load on this cluster so that it could recover. Our monitoring indicated that the majority of the load on this cluster was coming from background jobs, so we began disabling them, expecting to see query throughput drop.
After several cycles of disabling jobs, load on the cluster was still high, so a cluster failover was attempted to see if the failure was due to a hardware issue. This, too, had no effect. We were also unable to deploy a code change intended to mitigate the issue because the unhealthy Redis cluster was preventing new application servers from booting. An attempt to vertically scale the cluster in place also failed to reduce CPU pressure.
We finally opted to provision a new, much larger Redis cluster to replace the overloaded one. Once it booted, we pointed a fresh application deployment at it, and finally restored service to our customers. However, several questions remain unanswered at this point, prompting us to dig in and uncover the actual root cause.
Root Cause Analysis
In the days since the outage, we have reconstructed a clear picture of what happened during the first minute.
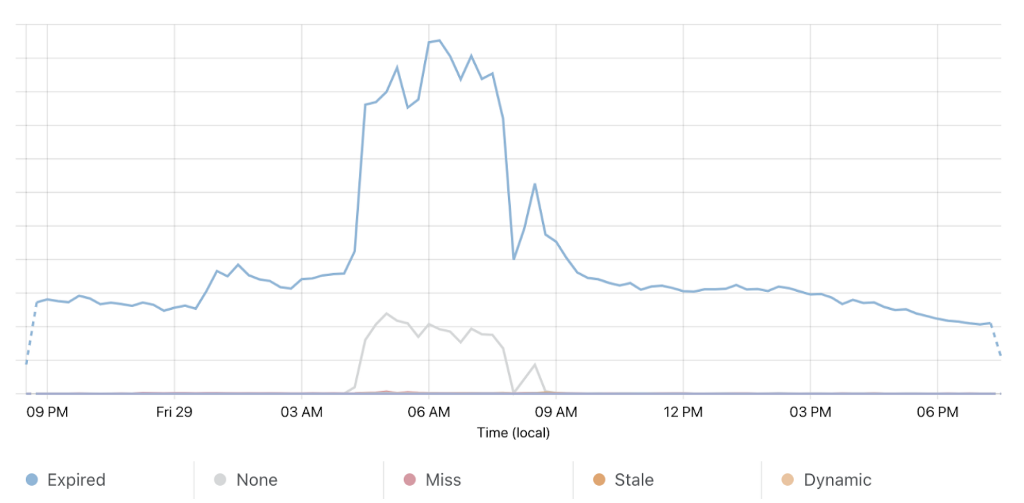
00:00s — A Memcached node reboots. This Memcached deployment provides a read-through cache in front of the keys that store exchange rates in the Redis cluster that failed. The reboot corresponded with a brief spike in cache misses while the clients shifted their queries to another Memcached cluster member. This is not an unprecedented occurrence, and in this case the Memcached clients recovered quickly as expected.
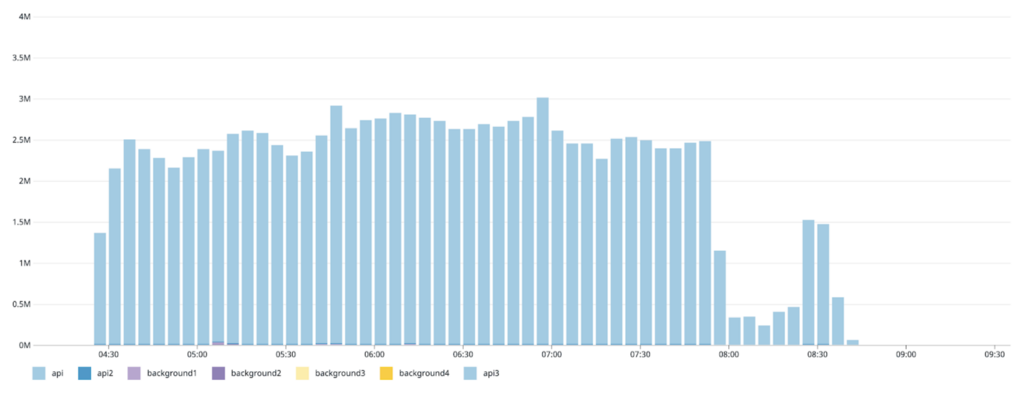
2. 00:02s — Concurrent Redis queries spike and connection pools fill up. The simultaneous cache misses due to the Memcached node restart caused a stampede of queries for the underlying data stored in the Redis cluster. The increased volume of concurrent queries required a 50x increase in the number of Redis connections to serve them.
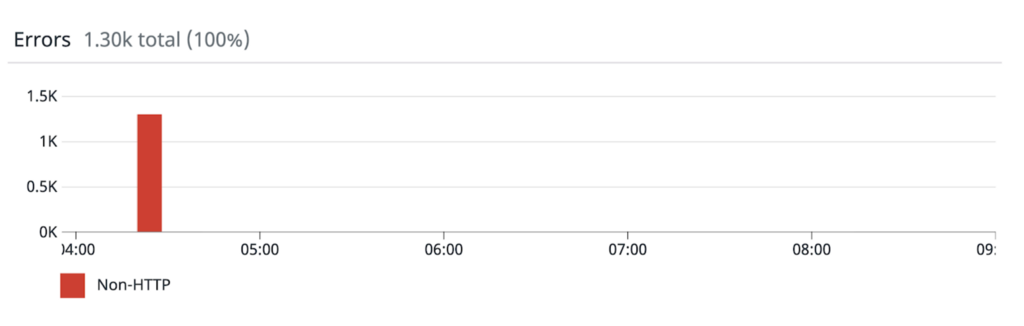
3. 00:07s — We see a high rate of Redis client timeout errors. The sudden influx of connections created a slow-down in the Redis engine. CPU utilization jumped to 100% and it stopped being able to respond to queries within a 1 second timeout. At this point, the error rate on our price data API endpoints was around 90%. These timeouts prevented memcached from replenishing its cache, so load on this Redis cluster remained high from this point on.
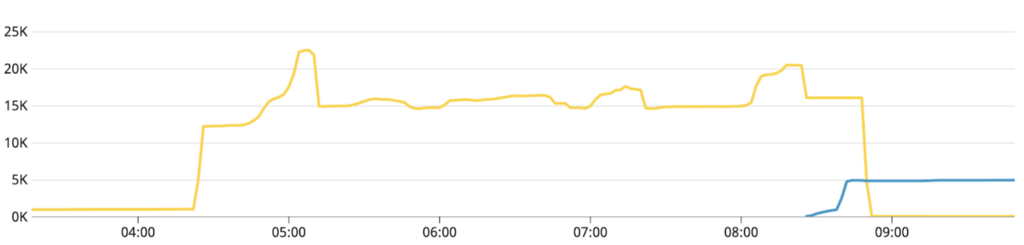
4. 00:13s — The 5 second cache TTL at the CDN for all public price data expired. Normally, load on the application for these endpoints is stable, thanks to the CDN cache. During this time, it spiked to 5x normal volume because the CDN began forwarding requests to the app to replenish its cache for all asset price data. Due to the 90% error rate on these endpoints, it was unable to successfully refresh the cache for the vast majority of keys. The application code fell through to Redis to load this data because of the Memcached misses, which further increased load on the already overloaded cluster.
At this point, the Redis cluster was receiving a throughput of queries many times its normal load, and the layers of cache above it (Memcached and the CDN) were unable to replenish because of Redis client timeouts and connection failures. Any requests which relied on exchange rate data were failing, and users were therefore unable to access critical functionality on our site. The cycle of cache misses and client timeouts kept this Redis cluster overloaded for the duration of the outage despite several attempts to reduce load.
Looking Ahead
With the clarity of hindsight, we’ve identified some blind spots in our monitoring that prevented us from quickly understanding the failure.
Our client-side Redis monitoring did not include timed out queries. This made it impossible for us to see that the application was overloading Redis, since we were only looking at successful calls, which decreased during the outage.
Our server-side Redis monitoring did not include failed calls. This made for a confusing dashboard that showed a sharp increase in network activity, but no apparent query activity. Our metrics are derived from the Redis INFO commandstats output, and did not include failed_calls or rejected_calls.
The Memcached node restart was only discovered after the incident because this information was not surfaced on any of our dashboards.
In addition, our application was configured in a way that allowed an initial small failure to cascade into a full-blown outage.
Client connection pools grew to 50x size almost instantly, overwhelming Redis with new connections. To counter this, we’ve tuned connection pool sizes to have more generous minimums and sane maximums.
The Redis cluster was underprovisioned. We’ve replaced it with an appropriately sized cluster and have audited our remaining clusters to ensure they are correctly scaled.
We were not making use of read-only replicas on this cluster. We are exploring wider use of Redis secondary reads to better scale this and similar use cases.
Another important observation is that an outage in one area of our API was able to interrupt service across all of it. We are currently working to decompose our monolithic application server into separate services in order to prevent these types of outages going forward. Pulling this part of the API into a separately scalable unit will let us isolate it from issues elsewhere, and prevent it from disrupting other features.
We take the uptime and performance of our infrastructure very seriously, and we’re working hard to support the millions of customers that choose Coinbase to manage their cryptocurrency. If you’re interested in solving scaling challenges like those presented here, come work with us .

was originally published in The Coinbase Blog on Medium, where people are continuing the conversation by highlighting and responding to this story.


