
Today, we apply what we learned. We’ll read current market conditions using Ichimoku, then show you how to supercharge your analysis by pairing Ichimoku with indicators you already know: RSI, Volume, and MACD.
By the end, you’ll know exactly how to combine tools for higher-conviction trades.
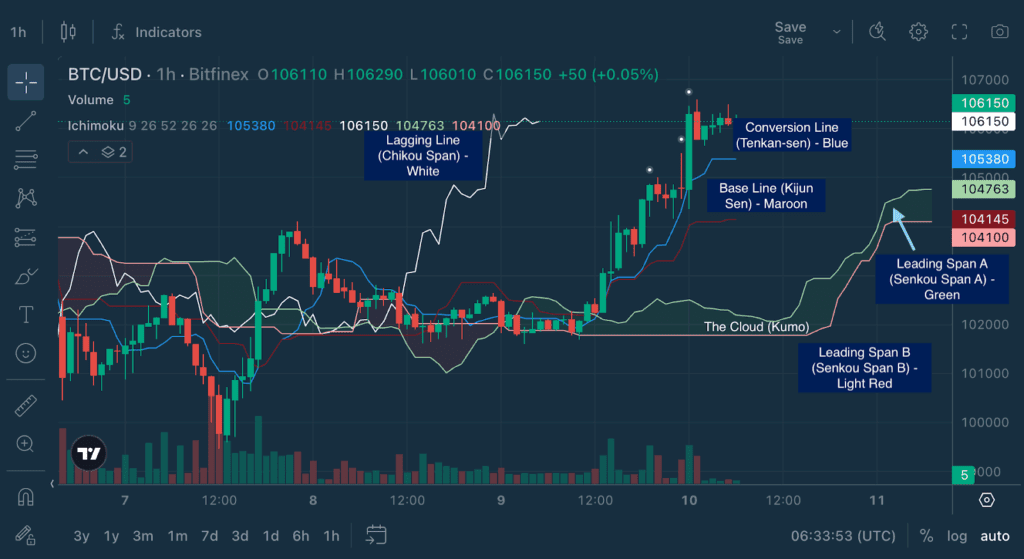
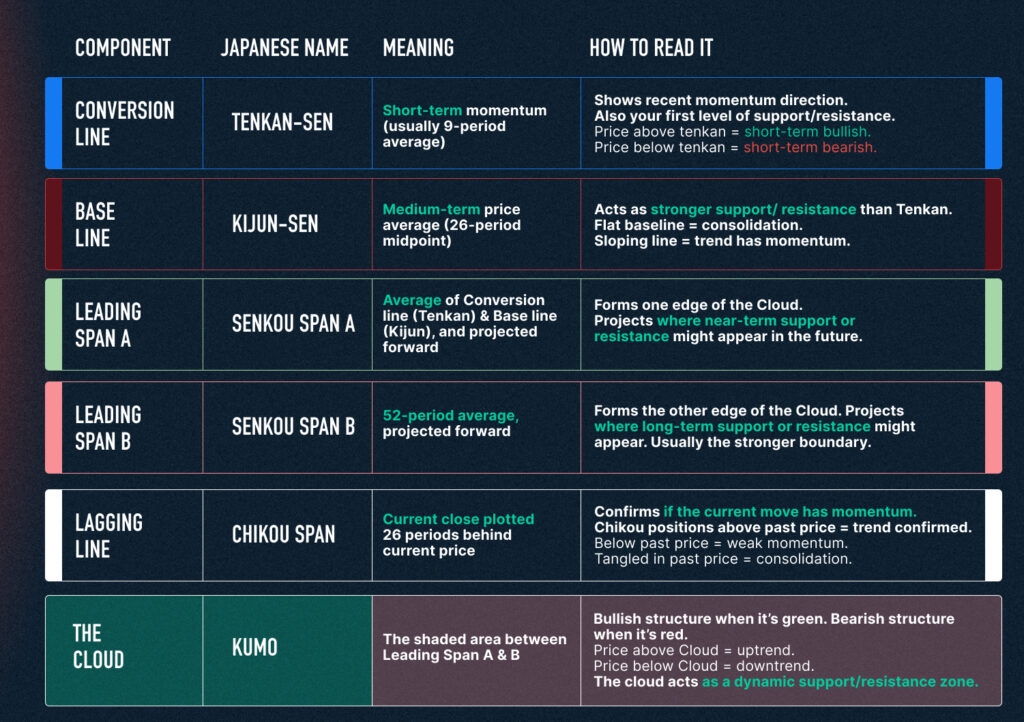
Quick Recap: The Ichimoku Components
If you missed Part 1 or need a refresher, here’s your cheat sheet:
Reading Actual Market: What Is Ichimoku Telling Us?
Let’s look at current market conditions and decode what Ichimoku is showing on both BTC/USDt 1H and 4H charts on January 12, 2026.
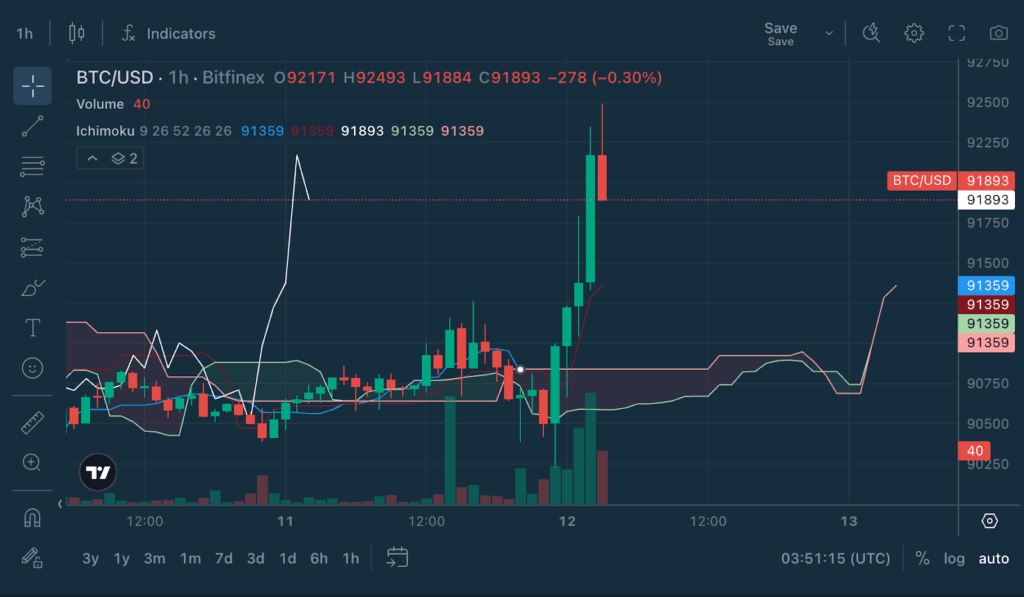
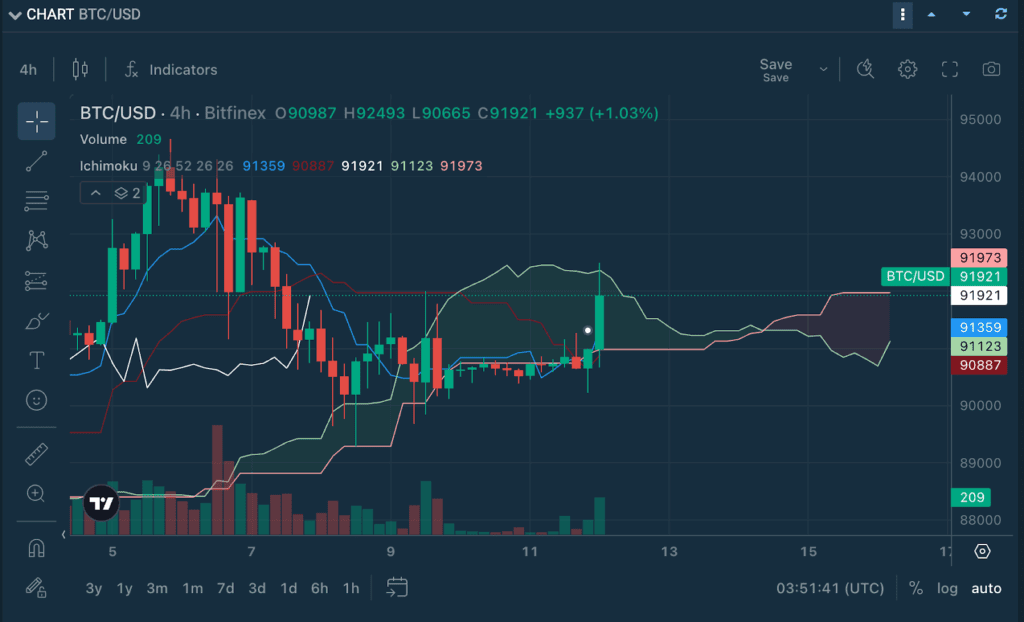
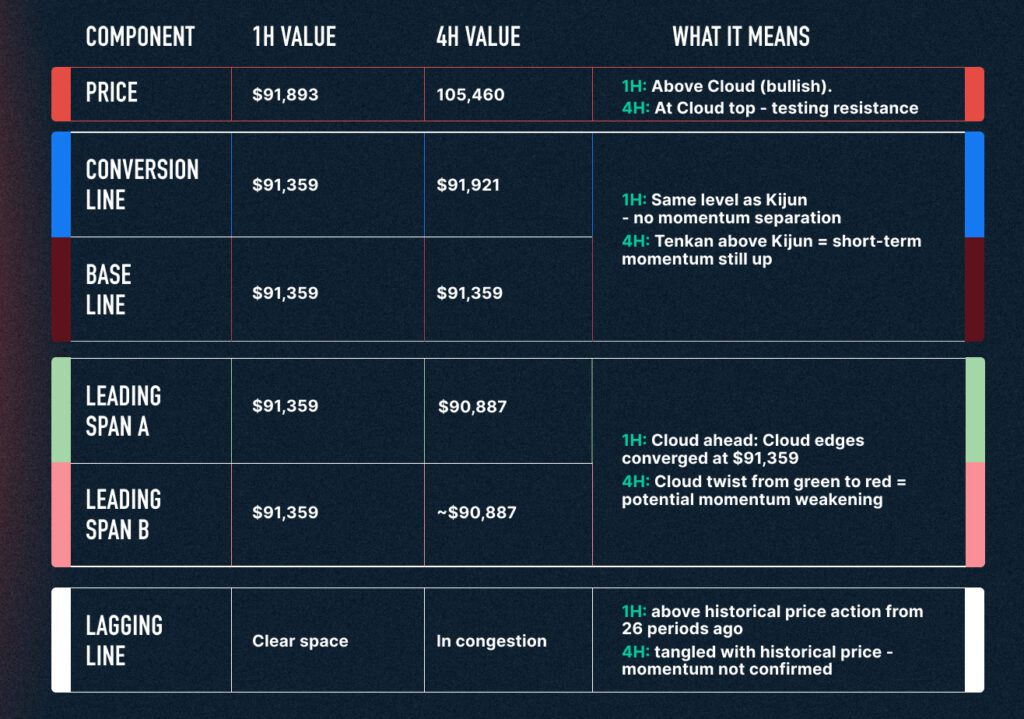
What the Cloud is telling us:
1H: Bullish structure – price above Cloud, holding above $91,359 support. Looks like healthy consolidation within uptrend.
4H: Price is at Cloud resistance, not above it. This is a breakout attempt in progress, not a confirmed breakout. The Chikou Span hitting congestion in past price action is a sign that momentum isn’t clean.
Bitcoin is at a critical decision point. The 1H shows short-term bullish structure, but the 4H reveals this is actually a Cloud breakout test. Price needs to clear $91,973 (4H Cloud top) convincingly, hold above it on pullbacks, and get Chikou Span clear of past congestion. Otherwise, this could be a failed breakout that leads to rejection back into the Cloud.
Key levels to watch:
Critical Resistance:
$91,973 – 4H Cloud top
$92,493 – Recent high, needs to clear this too
Support:
$91,359 – Both timeframes’ Tenkan support – critical
$90,887 – 4H Kijun + Cloud bottom zone
$90,665 – Session low
The outlook:
While Bitcoin appears bullish on the 1H chart alone, the 4H reveals Bitcoin is testing Cloud resistance, not comfortably above it. The 1H bullish structure is just price being above the thinner 1H Cloud, but we need conviction on the higher timeframe to confirm the bullish trend. The $91,300-$92,500 range is a compression zone where 1H Cloud support meets 4H Cloud resistance. Whichever breaks first (support or resistance) will determine the next major move.
How to Read Each Ichimoku Component as a Standalone Signal
One of Ichimoku’s underrated strengths: you don’t need to read all components together. Each component can work independently.
Conversion Line – Tenkan (blue): Momentum Indicator
Tenkan is your first sign for trend shifting. It moves fast because it only looks at the last 9 periods.
When the price stays above Tenkan, short-term momentum is strong. You’re in a healthy uptrend (or downtrend if below).
When price cuts through Tenkan repeatedly, bouncing above, then below, then above again momentum is weak and choppy. The market hasn’t decided yet. These are low-conviction zones. Avoid entries here.
How to use it:
In uptrends: Tenkan acts as your first support level. A pullback to Tenkan is often a buying opportunity if the broader trend is intact.
In downtrends: Tenkan acts as resistance. Rallies to Tenkan are often selling opportunities
Base Line – Kijun (maroon): Mean Reversion Level
Kijun is slower than Tenkan (26 periods), so it represents medium-term equilibrium. Markets have a magnetic relationship with Kijun. The price tends to gravitate back toward it after moving away.
If price holds above Kijun, the trend is healthy, bulls are in control.
If price loses Kijun and stays below, bears are taking over.
How to use it:
In strong trends, Kijun becomes dynamic support (in uptrends) or resistance (in downtrends).
When price stretches far from Kijun, expect a pullback toward it. Markets don’t stay stretched for long.
Kijun crosses with Tenkan (Tenkan crossing above or below Kijun) are early momentum signals. Not as strong as Cloud breaks, but worth noting.
Pro tip: If price returns to Kijun and bounces cleanly, that’s often a high-probability entry. The market just told you where fair value is, and it’s respecting it.
The Cloud – Kumo: Your Environment Filter
The Cloud is your macro context.
Price above the Cloud indicates a bullish environment. This is where you focus on long setups, look for pullbacks to buy, and expect support levels to hold. The bias is toward continuation higher.
Price below the Cloud suggests a bearish environment. This is where you focus on short setups, look for rallies to sell, and expect resistance levels to reject price. The bias is toward continuation lower.
Price inside the Cloud signals uncertainty and consolidation. The market is in equilibrium, chopping back and forth without clear direction. These periods tend to produce false breakouts, whipsaws, and noise. For most traders, the best move when price is inside the Cloud is to wait for a clean break.
How to use it:
The Cloud isn’t just support and resistance, it’s projected support and resistance. It shows you where the market thinks equilibrium will be 26 periods from now.
A thick Cloud means strong conviction. A thin Cloud means weak conviction. Same signal, different confidence levels.
When the Cloud changes colour (green to red or vice versa), it’s a major shift. The market’s entire outlook is flipping.
How to best pair Ichimoku with other indicators for high probability set up?
Power Combo #1: Ichimoku + RSI
Why this works: Ichimoku shows structure. RSI shows momentum extremes. Together, they spot high-probability reversals.
Cloud Bounce + RSI Oversold = High-Probability Long The price is in an uptrend (trading above a green Cloud). The price pulls back to Cloud support. RSI drops below 30. Entry when price bounces off Cloud edge as RSI rises. You’re buying at the structural support when momentum is exhausted.
Cloud Resistance + RSI Overbought = High-Probability Short The price is in a downtrend (trading below a red Cloud). The price rallies to Cloud resistance in a downtrend. RSI rises above 70. Entry when price rejects Cloud edge as RSI falls. You’re selling into strength at a known ceiling.
RSI Divergence at Cloud Edges = Reversal Warning The price makes a new high/low but RSI doesn’t confirm. This happens at a Cloud edge. Signal: trend exhaustion. Wait for the price to break back through the Cloud to confirm.
The golden rule: Don’t just buy oversold RSI. Buy oversold RSI at Cloud support. Structure + momentum = edge.
Power Combo #2: Ichimoku + Volume
Why this works: Ichimoku tells you where the market might move. Volume tells you if that move has conviction.
Cloud Breakout + Volume Spike = Real Breakout The price breaks above/below the Cloud. Volume surges to 2-3x average. This confirms real market participation. Low-volume breakouts often fail and get pulled back into the Cloud.
Cloud Bounce + Rising Volume = Buyers Stepping In The price tests Cloud support. Volume increases as price bounces. This shows buyers are defending the level. Weak-volume bounces often fail on the next test.
Price Inside Cloud + Flat Volume = Stay Out The price is chopping inside the Cloud. Volume is below average. This signals indecision. Wait for a breakout with volume before entering.
The golden rule: High volume validates. Low volume questions. Trust breakouts and bounces with volume.
Power Combo #3: Ichimoku + MACD
Why this works: Ichimoku gives you market structure. MACD gives you momentum, direction and strength. Together, they help you time entries with precision.
Tenkan/Kijun Cross + MACD Cross = Full Momentum Alignment Tenkan crosses above Kijun (bullish) or below (bearish). MACD crosses in the same direction around the same time. Both indicators confirming the same momentum shift. Strongest when this happens above the Cloud (bulls) or below (bears).
Price Above Cloud + MACD Histogram Growing = Trend Acceleration Price is riding above a green Cloud. MACD histogram bars are getting taller. Signal: momentum is building, trend is strengthening. Good for adding to positions or holding longer.
MACD Divergence + Cloud Rejection = Trend Exhaustion Price makes a new high but MACD makes a lower high. This happens at a Cloud resistance level. Warning: momentum is fading even as price extends. Consider reducing position or tightening stops.
The golden rule: Use MACD to confirm what Ichimoku is showing you. Aligned crosses = high conviction.
Setting Up Ichimoku Cloud on Bitfinex
Go to trading.bitfinex.com
Select your trading pair (BTC/USD, ETH/USD, etc.)
Click Indicators in the chart toolbar
Search for and select Ichimoku Cloud
Use default settings (9, 26, 52, 26, 26). These work well for most markets
Observe how the Cloud projects future support and resistance zones

Explore the full Chart Decoder library:
SMA vs EMA for trend direction
MACD for momentum shifts
RSI for overbought/oversold zones
Bollinger Bands for volatility and price extremes
Stochastic Oscillator for timing reversals
VWAP for fair price detection
Volume + OBV for spotting smart money flow
ATR for volatility-based risk management
Fibonacci Retracements for market pullbacks
StochRSI for precision timing
Ichimoku Cloud Part 1 for understanding the 5 components of the Cloud
The post Chart Decoder Series: Ichimoku Cloud Part 2 – Mastering Components & Powerful Indicator Pairings appeared first on Bitfinex blog.


