
The crypto market has been trending in tandem with global risk assets in recent months, with a particularly strong correlation with the Nasdaq 100. Since the start of the year, cryptocurrencies have struggled as expectations for central bank rate hikes increased amid persistently high inflation, but have climbed off their worst levels of the past few weeks.
According to data from TradingView, BTC posted a marginal loss of 0.5% week-over-week, with its market capitalization falling short of the $450 billion mark. The price of BTC reached a high of $24,250 on July 30, but has since given up some of its gains as investors booked profits and rotated their capital into the altcoins sector.
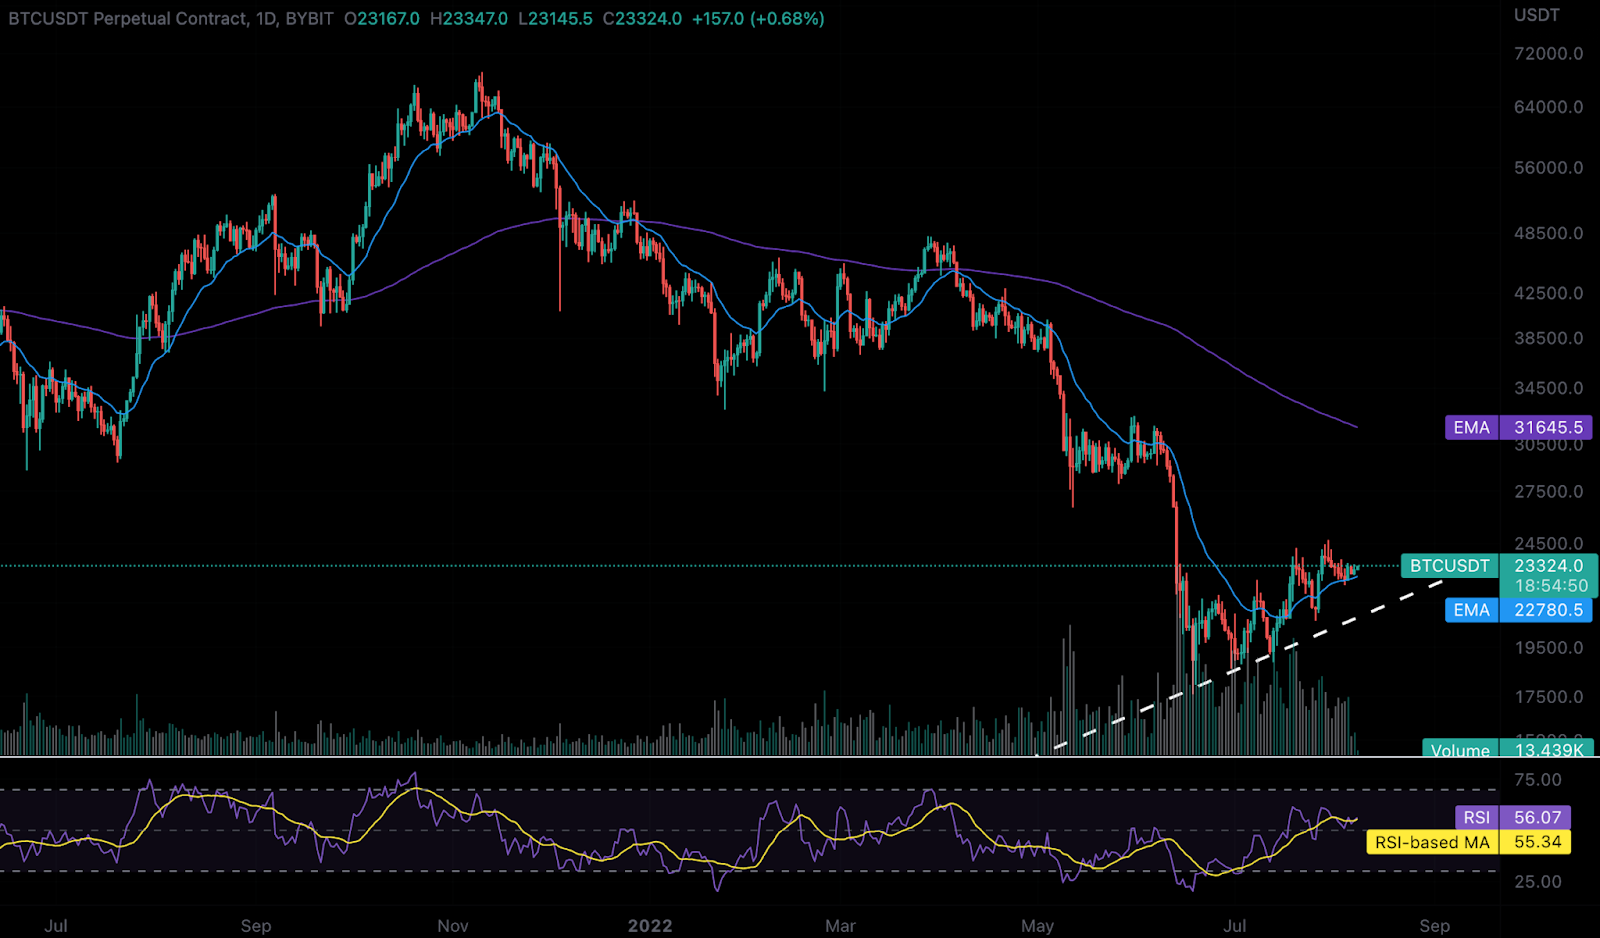
As of Monday morning (UTC), BTC has ascended a leg higher, with Bybit’s BTC Perpetual Contracts market changing hands at $23,324, up by over 2.5% from the previous day.
BTC's performance has been lackluster in the past week despite the announcement of BlackRock’s entry into providing Bitcoin exposure to its institutional clients. Investors seem to neglect the bellwether cryptocurrency due to the hype and attention surrounding ETH and its upcoming Merge. This may also explain BTC's slow and sideways movement over the past few days.
In spite of the recent slowdown, BTC appears on track for a trend recovery, one that could possibly see it retest the 200-day exponential moving average, which is currently projected at $31,645 at the time of writing. To achieve this goal, BTC must maintain its strong upward momentum in the coming weeks or months.
To measure and track the said momentum, we can look at two main factors: price action and speculative positioning.
In terms of price action, BTC must establish a strong foothold above the 20-day moving average support, which currently stands at $22,780. The 20-day moving average (MA) is considered a key indicator by many traders and market analysts with regard to determining the short-term market trend.
Ideally, BTC should form a continuation pattern above the 20-day moving average in the form of a triangle, flag, or pennant formation, where a breakout above said continuation pattern could lead to an immediate retest of May's price consolidation range at $26,000 to $28,000.
The second factor that is extremely crucial to BTC’s bull case would be speculative positioning, which refers to the level of speculative activity within the futures market. Speculative positioning can be observed via funding rates which are periodic payments made between buyers and sellers in the perpetual futures market.
Typically, funding rates would increase in tandem with price movements in a bullish market. Thus, investors should keep a close eye on BTC funding rates for aggressive spikes.
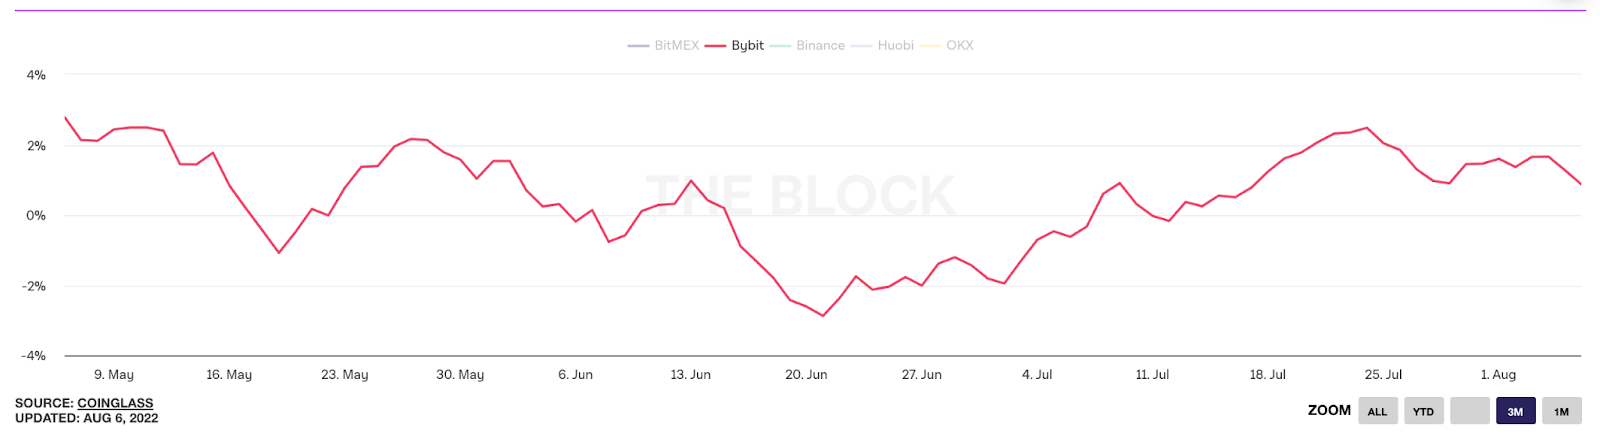
BTC funding rates have been trending higher since the lows of June 21. Notably, BTC funding rates have remained in positive territory for five consecutive weeks. This indicates a shift in traders’ sentiments, as their risk appetites for growth seem to be increasing.
Check Out the Latest Prices, Charts and Data for BTCUSDT !
The past week has been a stellar one for altcoins, with some coins posting double-digit gains. FLOW, the native token of the Flow network, emerged as one of the top performing cryptocurrencies after rallying over 54% in the past week.
This rally follows an announcement made by Meta Platforms (META) regarding the expansion of its Instagram NFT feature. Instagram now supports NFTs in 100 countries, with the Flow network providing the back-end infrastructure. The news of the announcement quickly circulated, and FLOW blockchain gained increased recognition as a result.
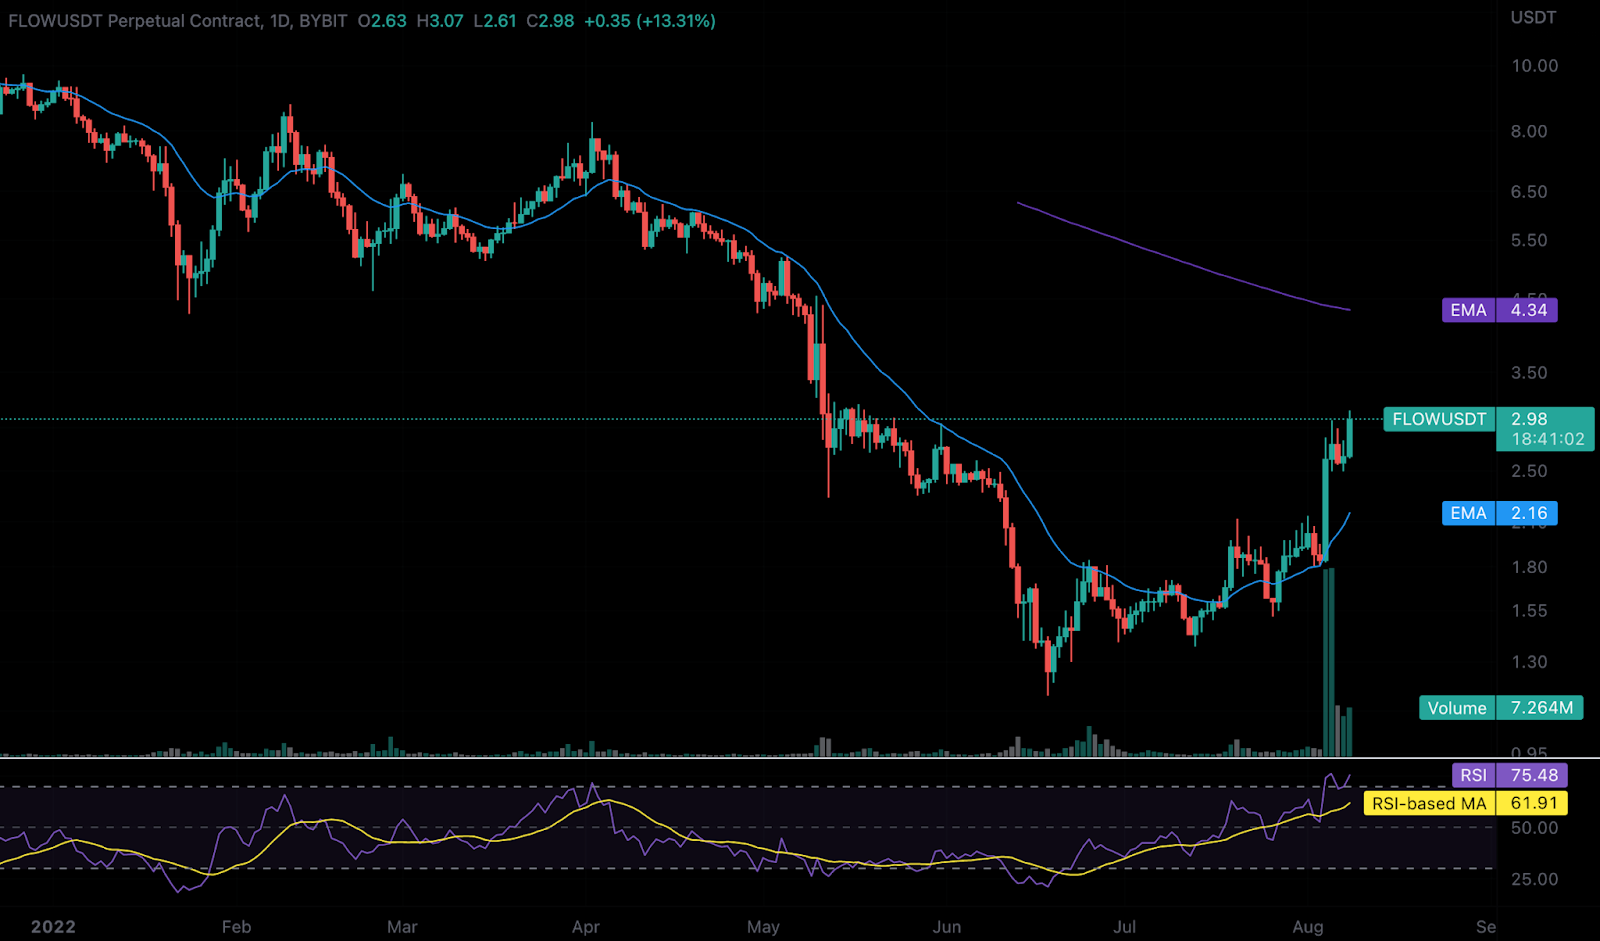
In spite of its recent surge, FLOW still stands at 93% below its all-time high of $46.16, recorded in April 2021, according to CoinMarketCap data. FLOW’s latest development may create a long-term value opportunity for bargain hunters.
A note of caution for short-term traders is that the daily relative strength index (RSI) reading has started to enter the overbought territory, which means early buyers may look to book profits. As such, investors can expect some price volatility in the coming days following a week of tremendous growth. A healthy pullback towards its 20-day moving average of $2.16 (as of the time of writing) could present a good opportunity for investors to establish long-term positions.
Check Out the Latest Prices, Charts and Data for FLOWUSDT !
Market Movers (Week-on-Week)
New Derivatives Listings — What’s New on Bybit?
Trade with up to 25x leverage on our new trading pairs: