Why the Fate of Polygon (MATIC) Price Hangs on the $0.60 Mark
The Polygon ( MATIC) price is close to a fresh yearly low, trading beneath the pivotal $0.60 horizontal support level.
Both the weekly and daily timeframes exhibit bearish price action and indicator readings, indicating an impending dip to a new yearly low.
Chart by TradingView.
Polygon Price Nears New Yearly Low
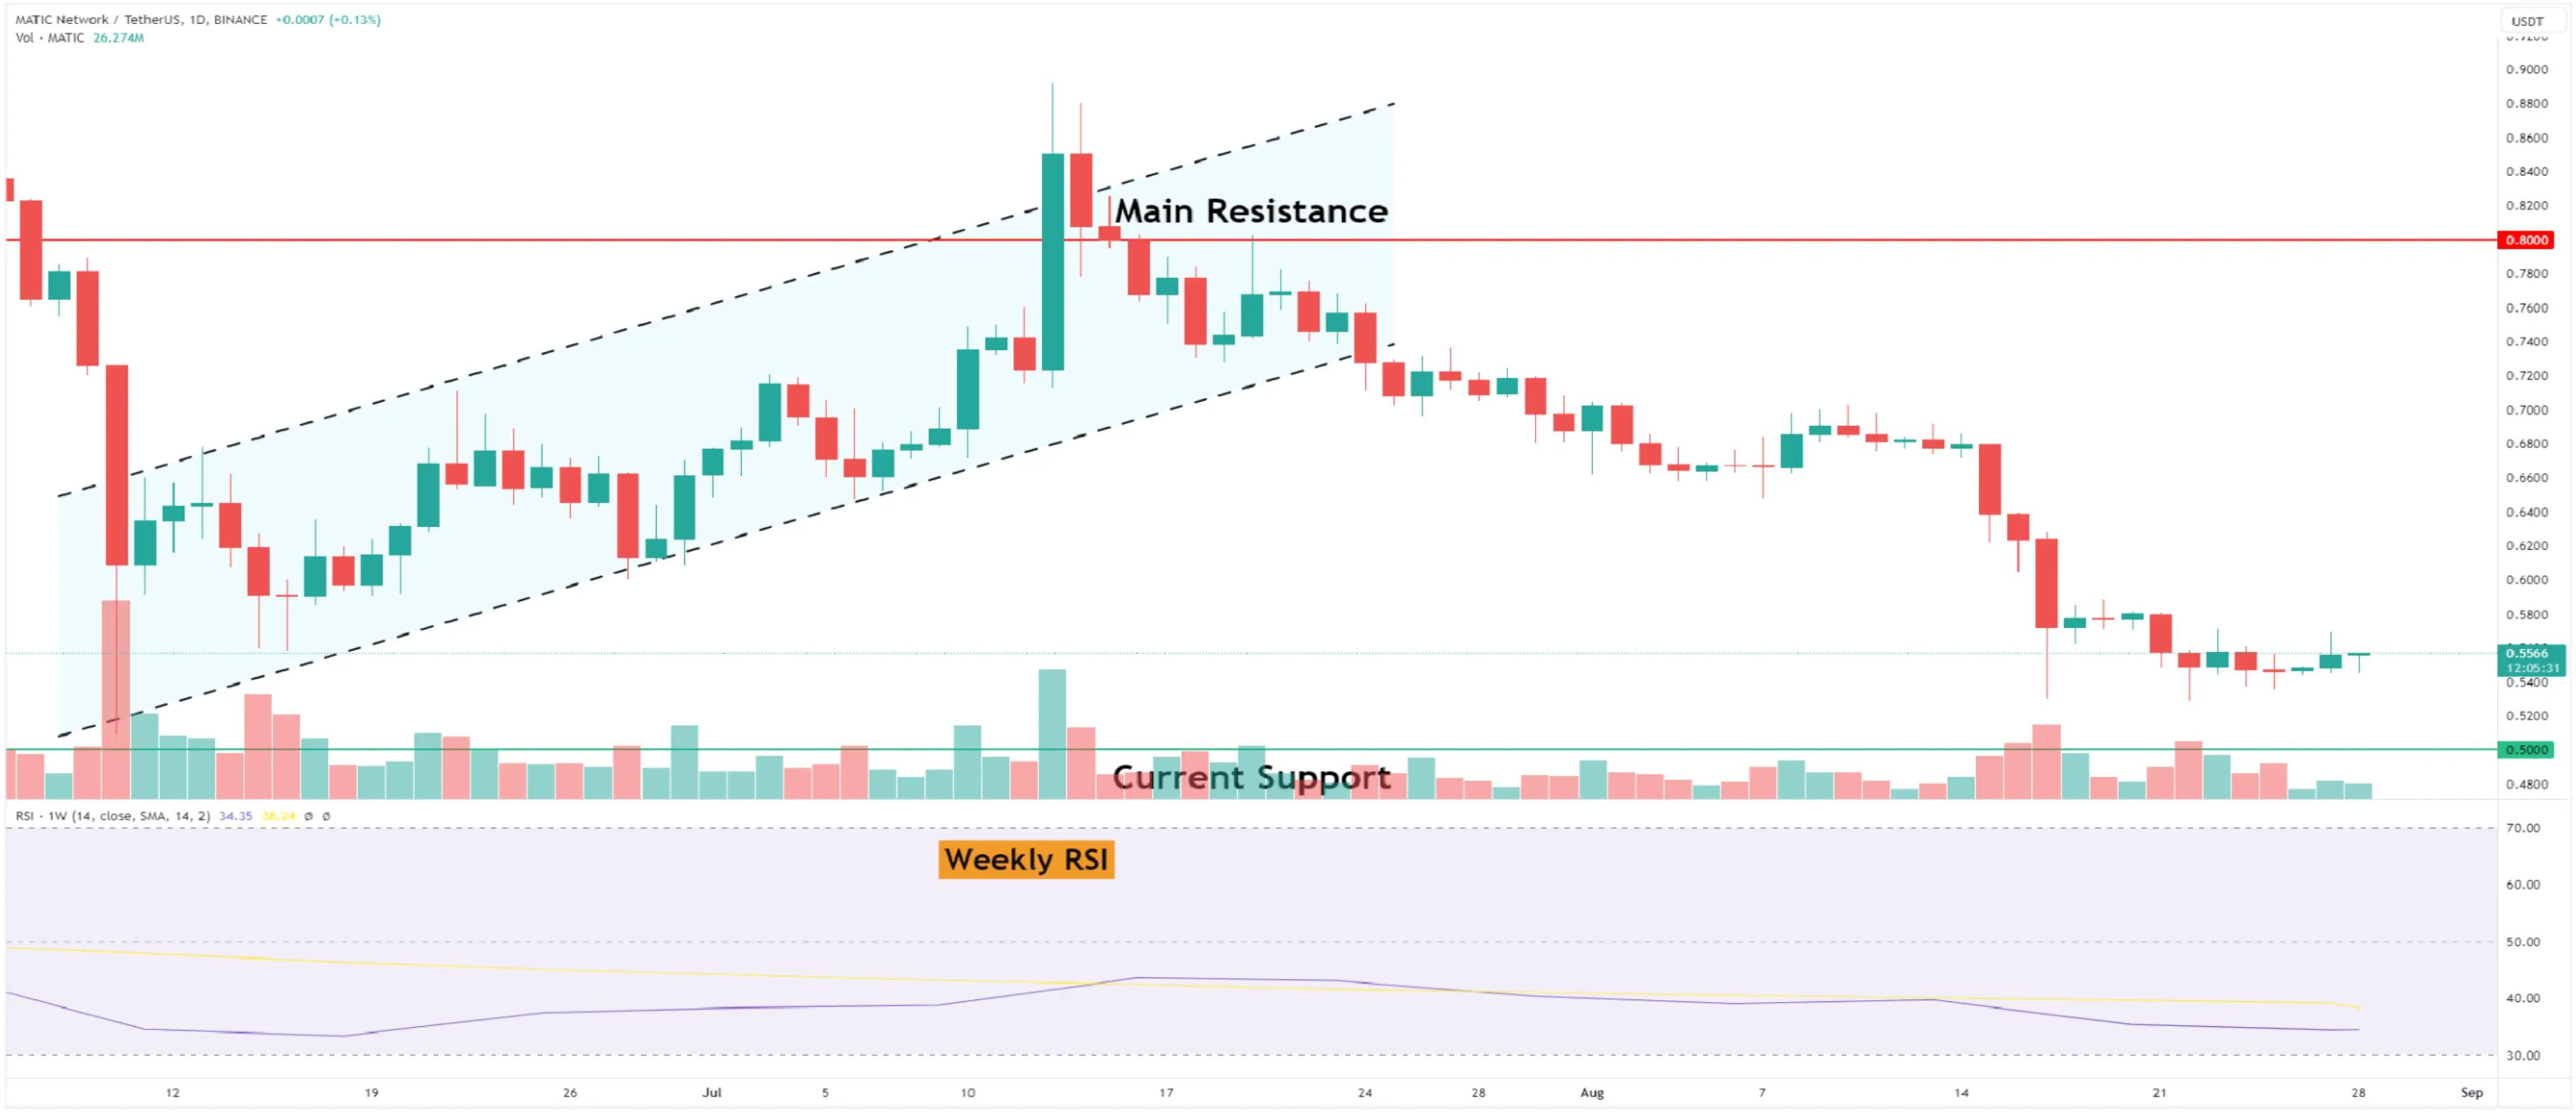
An analysis of the weekly timeframe reveals a bearish perspective for MATIC. The primary catalyst behind this is the breakdown from an ascending parallel channel in April.
This event carried significant weight as the channel had been in play for nearly a year. The definitive breakdown affirmed that the prior upswing was a correction and that the bearish trend prevailed.
Following the breakdown, MATIC descended beneath the $0.80 region. In July, it validated this level as resistance, forming an elongated upper wick. This phenomenon signifies selling pressure and reinforces the notion of sellers being in command.
The ongoing descent could potentially result in another 40% plunge to the $0.35 horizontal support area.
The bearish weekly Relative Strength Index (RSI) corroborates the sustained downward movement. A reading above 50 paired with an ascending trend benefits the bulls, while a reading below 50 implies the opposite. With the RSI reading below 50 and declining, a bearish trend signal emerges.
MATIC Price Projection: Where Might the Bottom Lurk?
The daily timeframe assessment for MATIC paints a bearish outlook based on price action.
Price action exhibits bearish traits due to an unsuccessful breakout attempt from a descending resistance line. After scaling to a peak of $0.90, MATIC underwent a substantial decline, breaching the $0.60 horizontal support area.
The $0.50 area is holding strong for now. A breakdown below $0.50 may send the price down to the next support at $0.35
Despite the bearish MATIC price prognosis, a robust rebound reclaiming the $0.60 support area could trigger a 40% surge toward the subsequent resistance at $0.80.


_webp.webp&w=3840&q=75)
_webp.webp&w=3840&q=75)


