.webp&w=3840&q=75)
What Is The Relative Strength Index RSI And How To Use It
In this edition of Crypto Trading 101, it’s time to talk about the Relative Strength Index - what it is, how to use it, and how to combine it with your crypto trading for better results.
What is the Relative Strength Index
Invented by J. Welles, the Relative Strength Index (RSI) measures the momentum of the price of your crypto asset.
Most of the time, the RSI is used by traders to define if the asset is overbought or oversold.
Overbought zones are areas where the price has risen significantly in a short time. It suggests that the price is overbought and can have a trend reversal or correction, therefore signaling a selling point.
Oversold zones, on the other hand, are areas where the price decreased drastically in a relatively short period. They are usually interpreted as buy points, since the price will likely go back up.
The classic way of trading with the RSI is to buy when the RSI is oversold and to sell when it is overbought. However on Cryptohopper we leave a lot of room for customization. You can set the RSI to send a buy/sell signal when the indicator is below or above or even equal to a certain value.
This means that you can even inverse the signals and buy at overbought and sell at oversold, making it work like a trend following indicator.
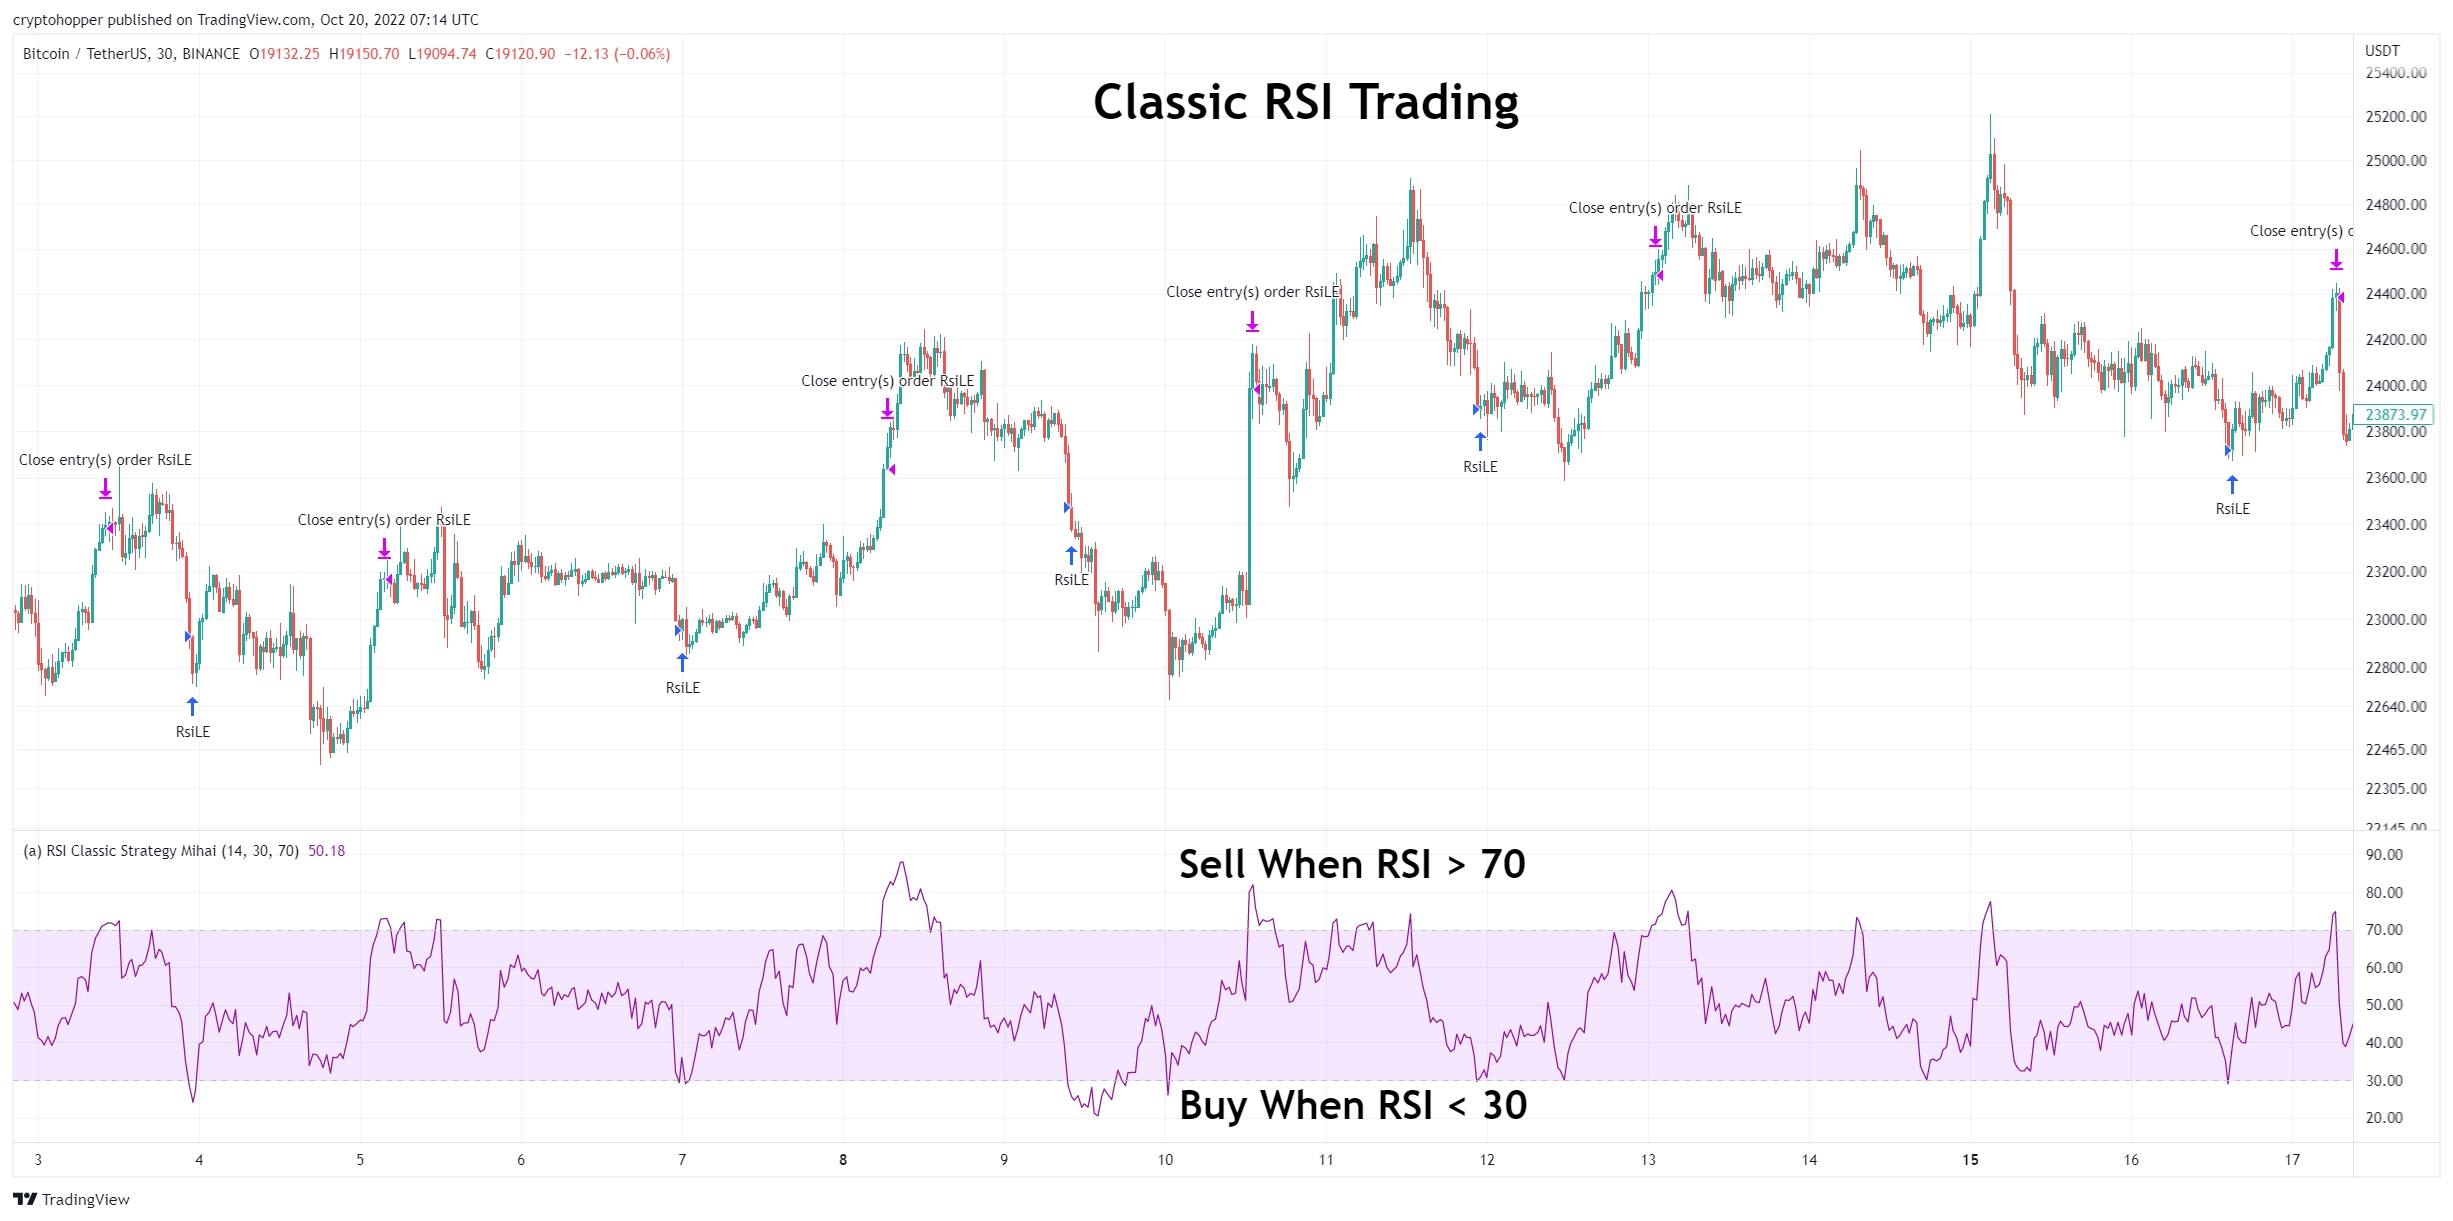
Let’s look at a small example of the RSI on a TradingView chart.
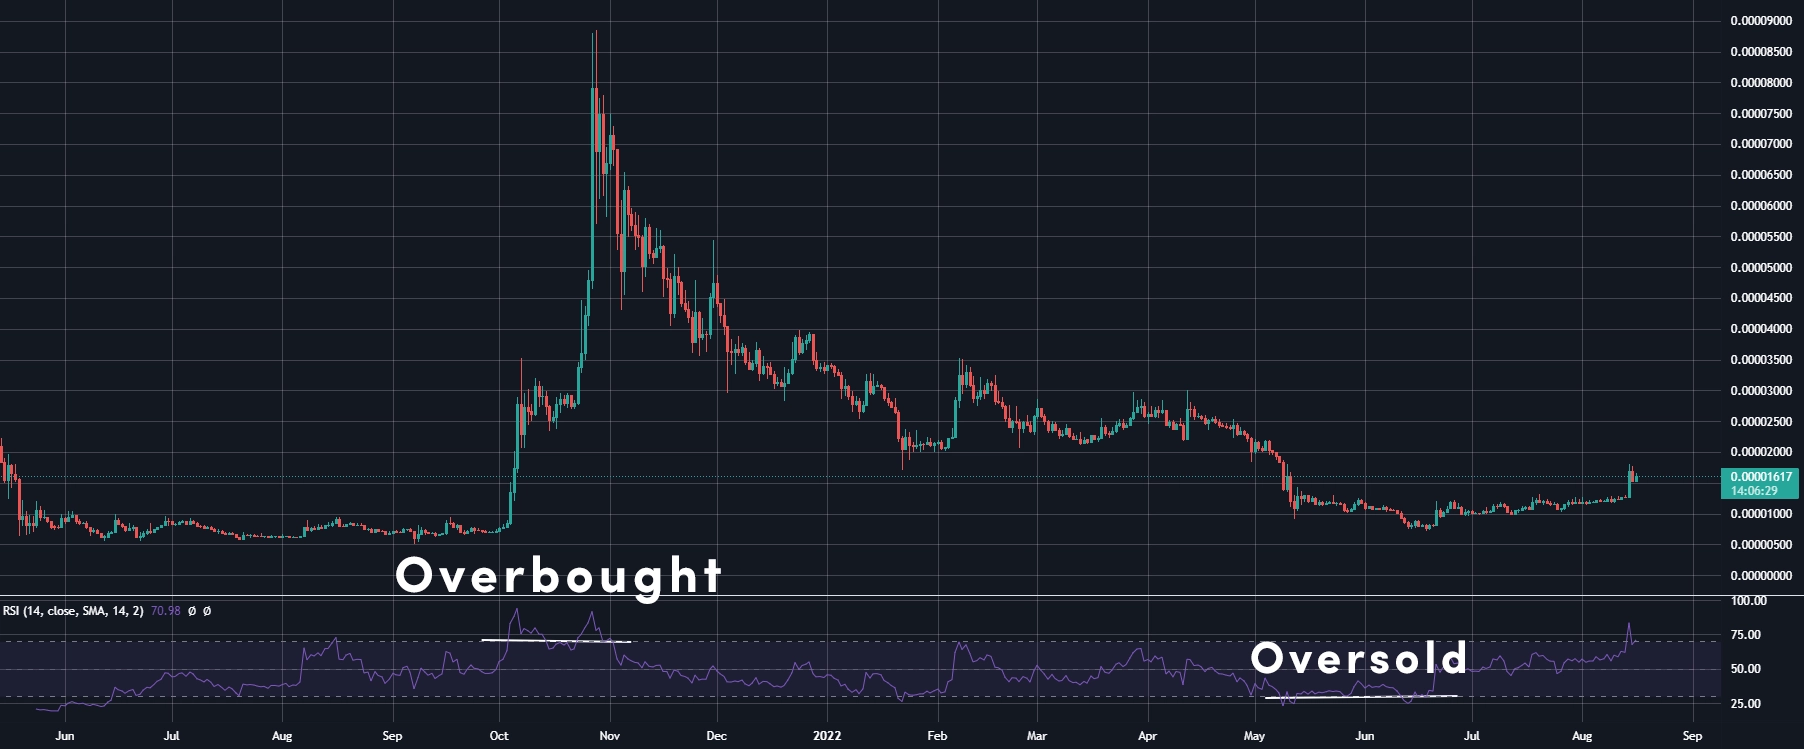
The RSI typically uses a 14-period timeframe, measured on a scale from 0 to 100, with high and low levels marked at 70 and 30, respectively.
Short or longer timeframes are used for alternately shorter or longer outlooks.
How does the Relative Strength Index work?
The RSI is a technical indicator that measures the strength of an asset’s recent price performance.
It's being used to identify overbought and oversold conditions. The RSI is calculated using a 14-day time frame, and is plotted on a scale from 0 to 100. A reading of 70 or above indicates that a security is overbought and may be due for a pullback.
A reading below 30 indicates that a security is oversold, and may be scheduled for a bounce.
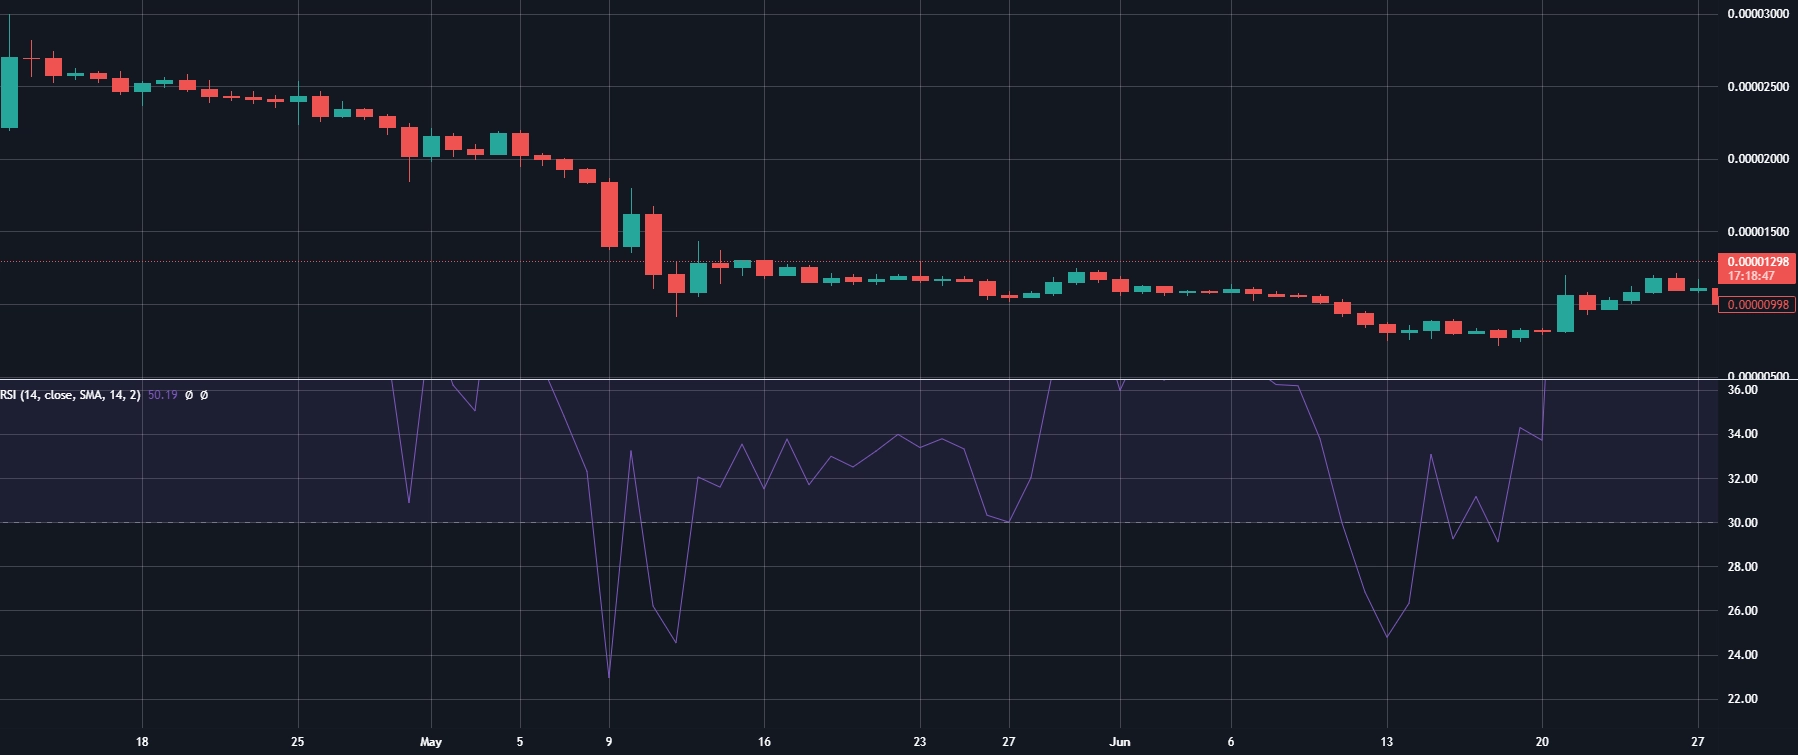
Here you can see that TradingView created a line at 30. Once the RSI crossed this line, you can see the asset become oversold. This also counts for the 70 lines. You can play around in TradingView to review it yourself.
Combining Relative Strength Index with Moving averages
The Relative Strength Index (RSI) is a momentum indicator that measures the speed and change of price movements. Moving averages are a trend-following indicator that smooths out price data by creating a single average price.
When these two indicators are combined, they can provide a complete picture of the market. The RSI can help identify overbought or oversold conditions, while the moving averages can help confirm the trend.
RSI + RSI With Crossovers
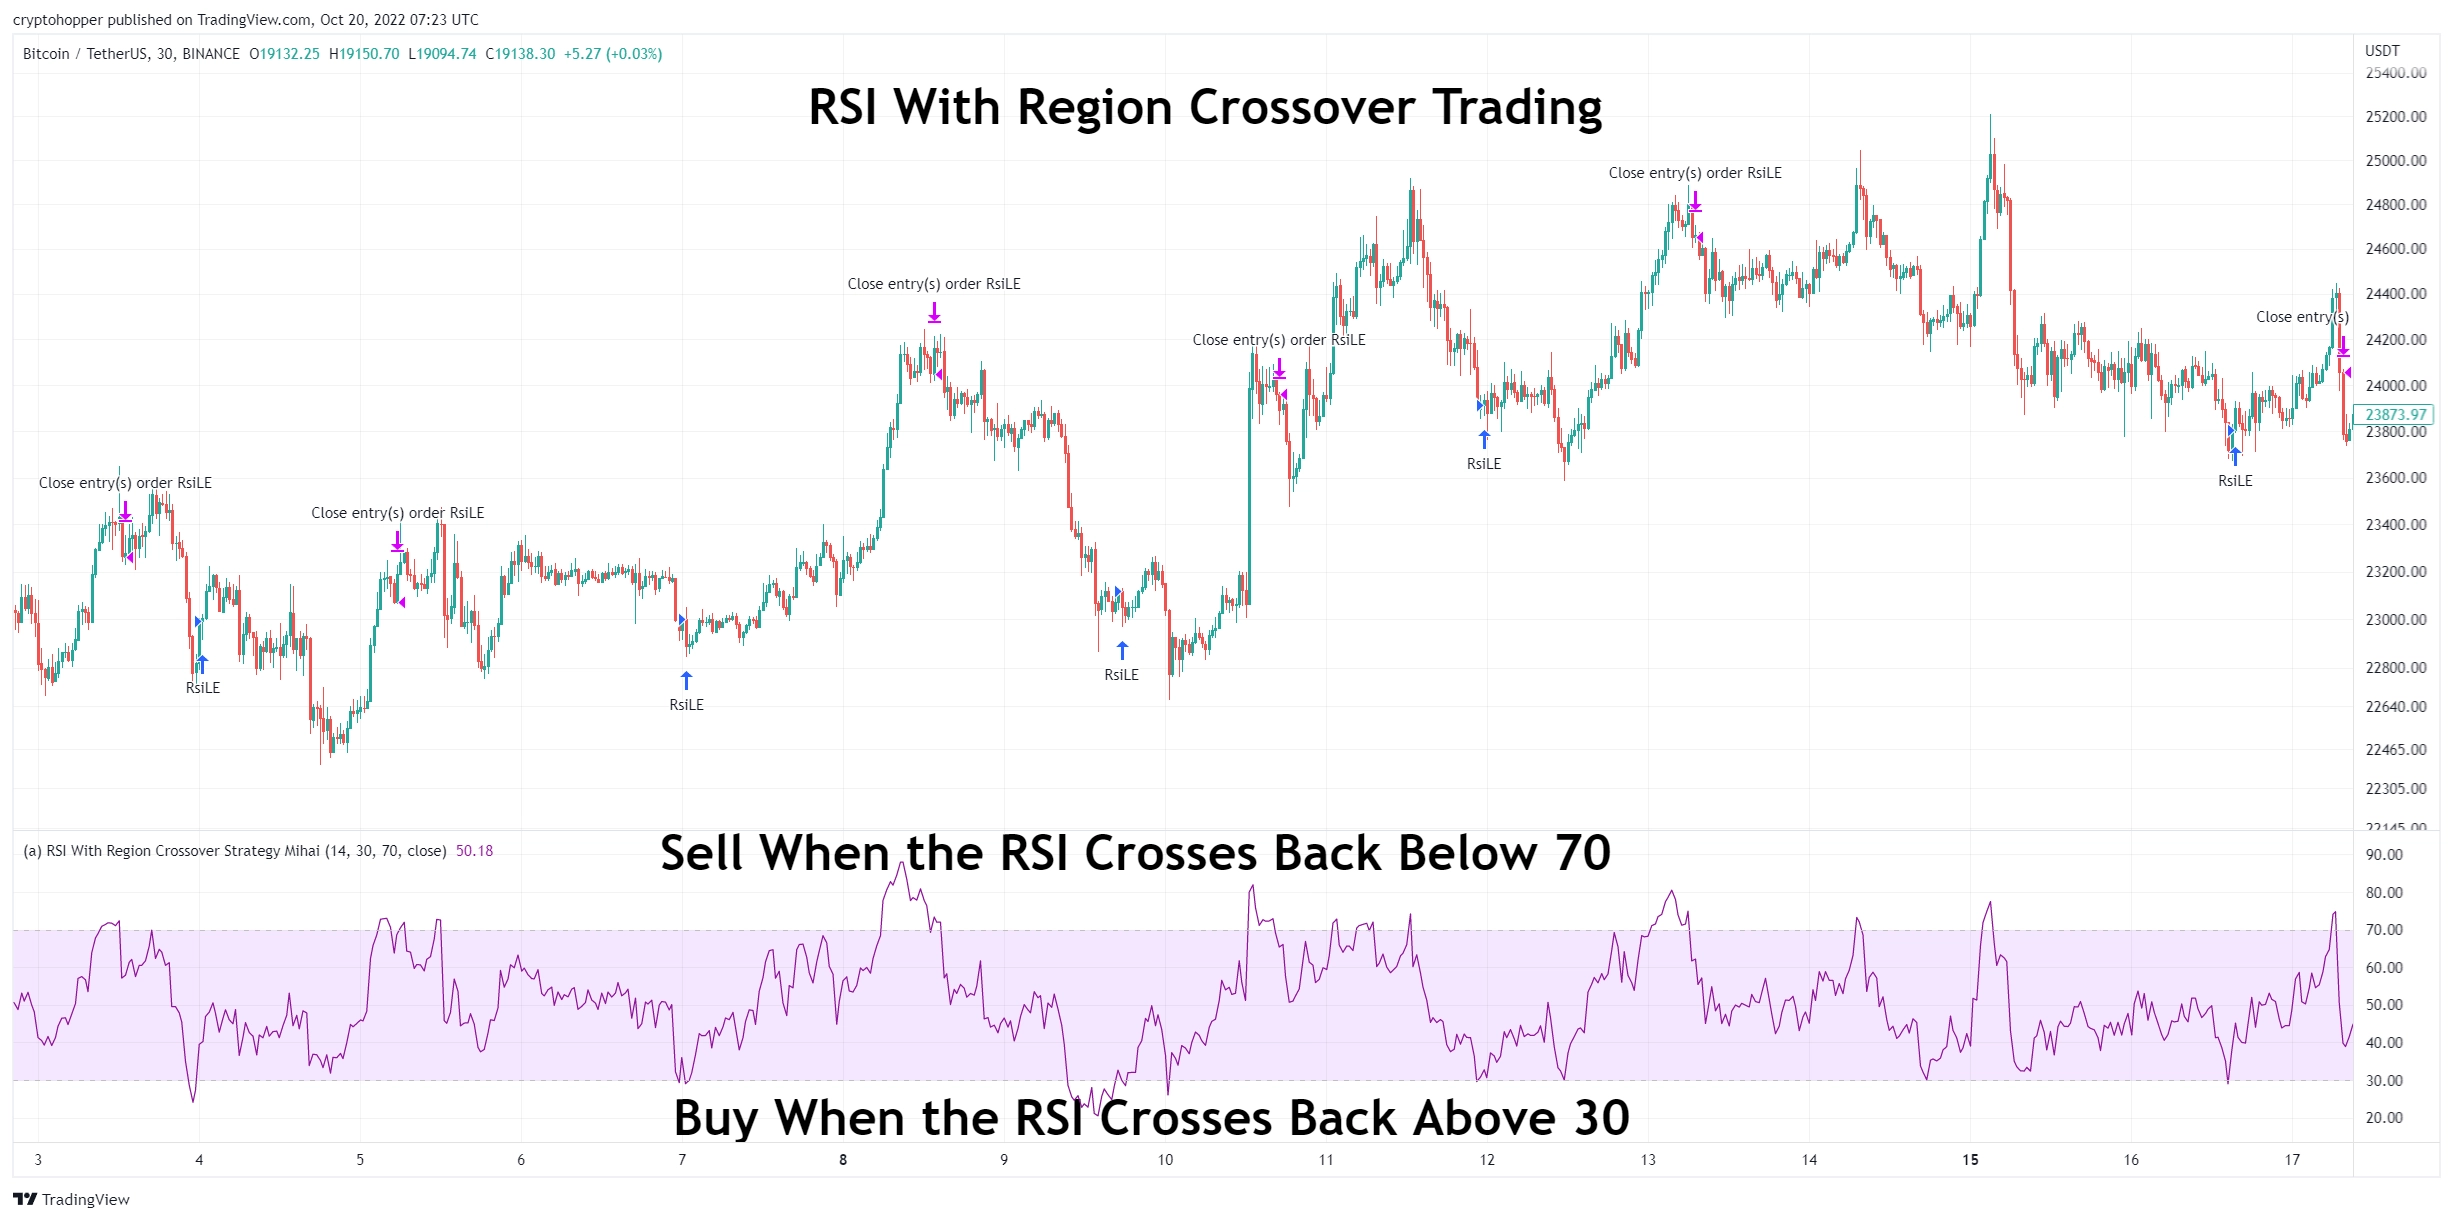
We also have another indicator variation named the RSI with Region Crossovers.
The RSI with Region Crossovers shares the same values as the regular RSI. The only difference lies in how it is traded. With the RSI with Region crossover, a buy signal is sent once the RSI comes out of an oversold area.
So, for example, let’s say you set the RSI oversold to 30. Therefore the RSI with Region Crossovers will send a buy signal when the value of the RSI goes below 30 and then climbs back up above 30.
This is great because it eliminates the biggest threat to oscillators I mentioned earlier. Since you are not buying a cryptocurrency that is constantly falling anymore, you are purchasing a currency that is starting to recover again.
The sell signal for the RSI with Region crossover is essentially the opposite and will occur when the value of the RSI comes down below the overbought threshold.
For example, imagine that the overbought point is 70. Thus you will get a sell signal when the RSI goes above 70 and then comes back below 70. This works great in a trending market because just as an asset can be oversold for a long time, it can also be overbought for a long time. If the price is currently high, it can still go significantly higher.
Therefore this will help you follow the trend more and sell significantly higher than a stable oscillator in a strong direction.
However, what is important to note here is that this is a one-off signal, not a sticking signal, as with regular oscillators. Therefore you will only get one sign at the crossover point. As a result, you will need to use the keep candle feature if you want to use it with other indicators that only give one signal.
Another option is to use it with Trend following indicators like the MESA or Parabolic SAR, which provide sticking signals.
Relative Strength Index on Cryptohopper
With Cryptohopper, you let the bot focus on the Relative Strength Index for you.
The trading bot will make trades based on the way the Relative Strength Index goes. You can also add multiple signals for your trading bot, so your bot can buy when the RSI is oversold, and when other signal conditions are met.


_webp.webp&w=3840&q=75)
_webp.webp&w=3840&q=75)


