
How to Measure the Strength of a Crypto Trend with the Aroon indicator.
In trading, there are only two decisions every trade must make. You can either be a trend follower or take a contrarian approach by trading against the trend. To succeed with both trading styles, you only need to know if the trend will continue or reverse. This is why everyone needs to learn how to measure the trend's strength.
What is the Aroon indicator?
The Aroon Indicator is a technical analysis tool that was developed by Tushar Chande in 1995.
It is used to measure the strength of a trend in an asset's price, and it does this by looking at the amount of time that the asset's price has been above or below a certain level. The Aroon indicator consists of two lines, the Aroon Up line and the Aroon Down line, which are used to identify the start and end of a trend.
The indicator is typically used to spot potential reversals in an asset's price, as well as to confirm the existence of a trend.
Why use the Aroon indicator?
Trading can be an emotional-driven process. However, you can overcome the emotional bias in your trading using mechanical trading rules. For this reason, one of the simplest ways to gauge the trend strength is to use a trend-following indicator like the Aroon.
How to Measure the Strength of the Trend
There are only two rules that you need to know to measure the strength of a crypto trend:
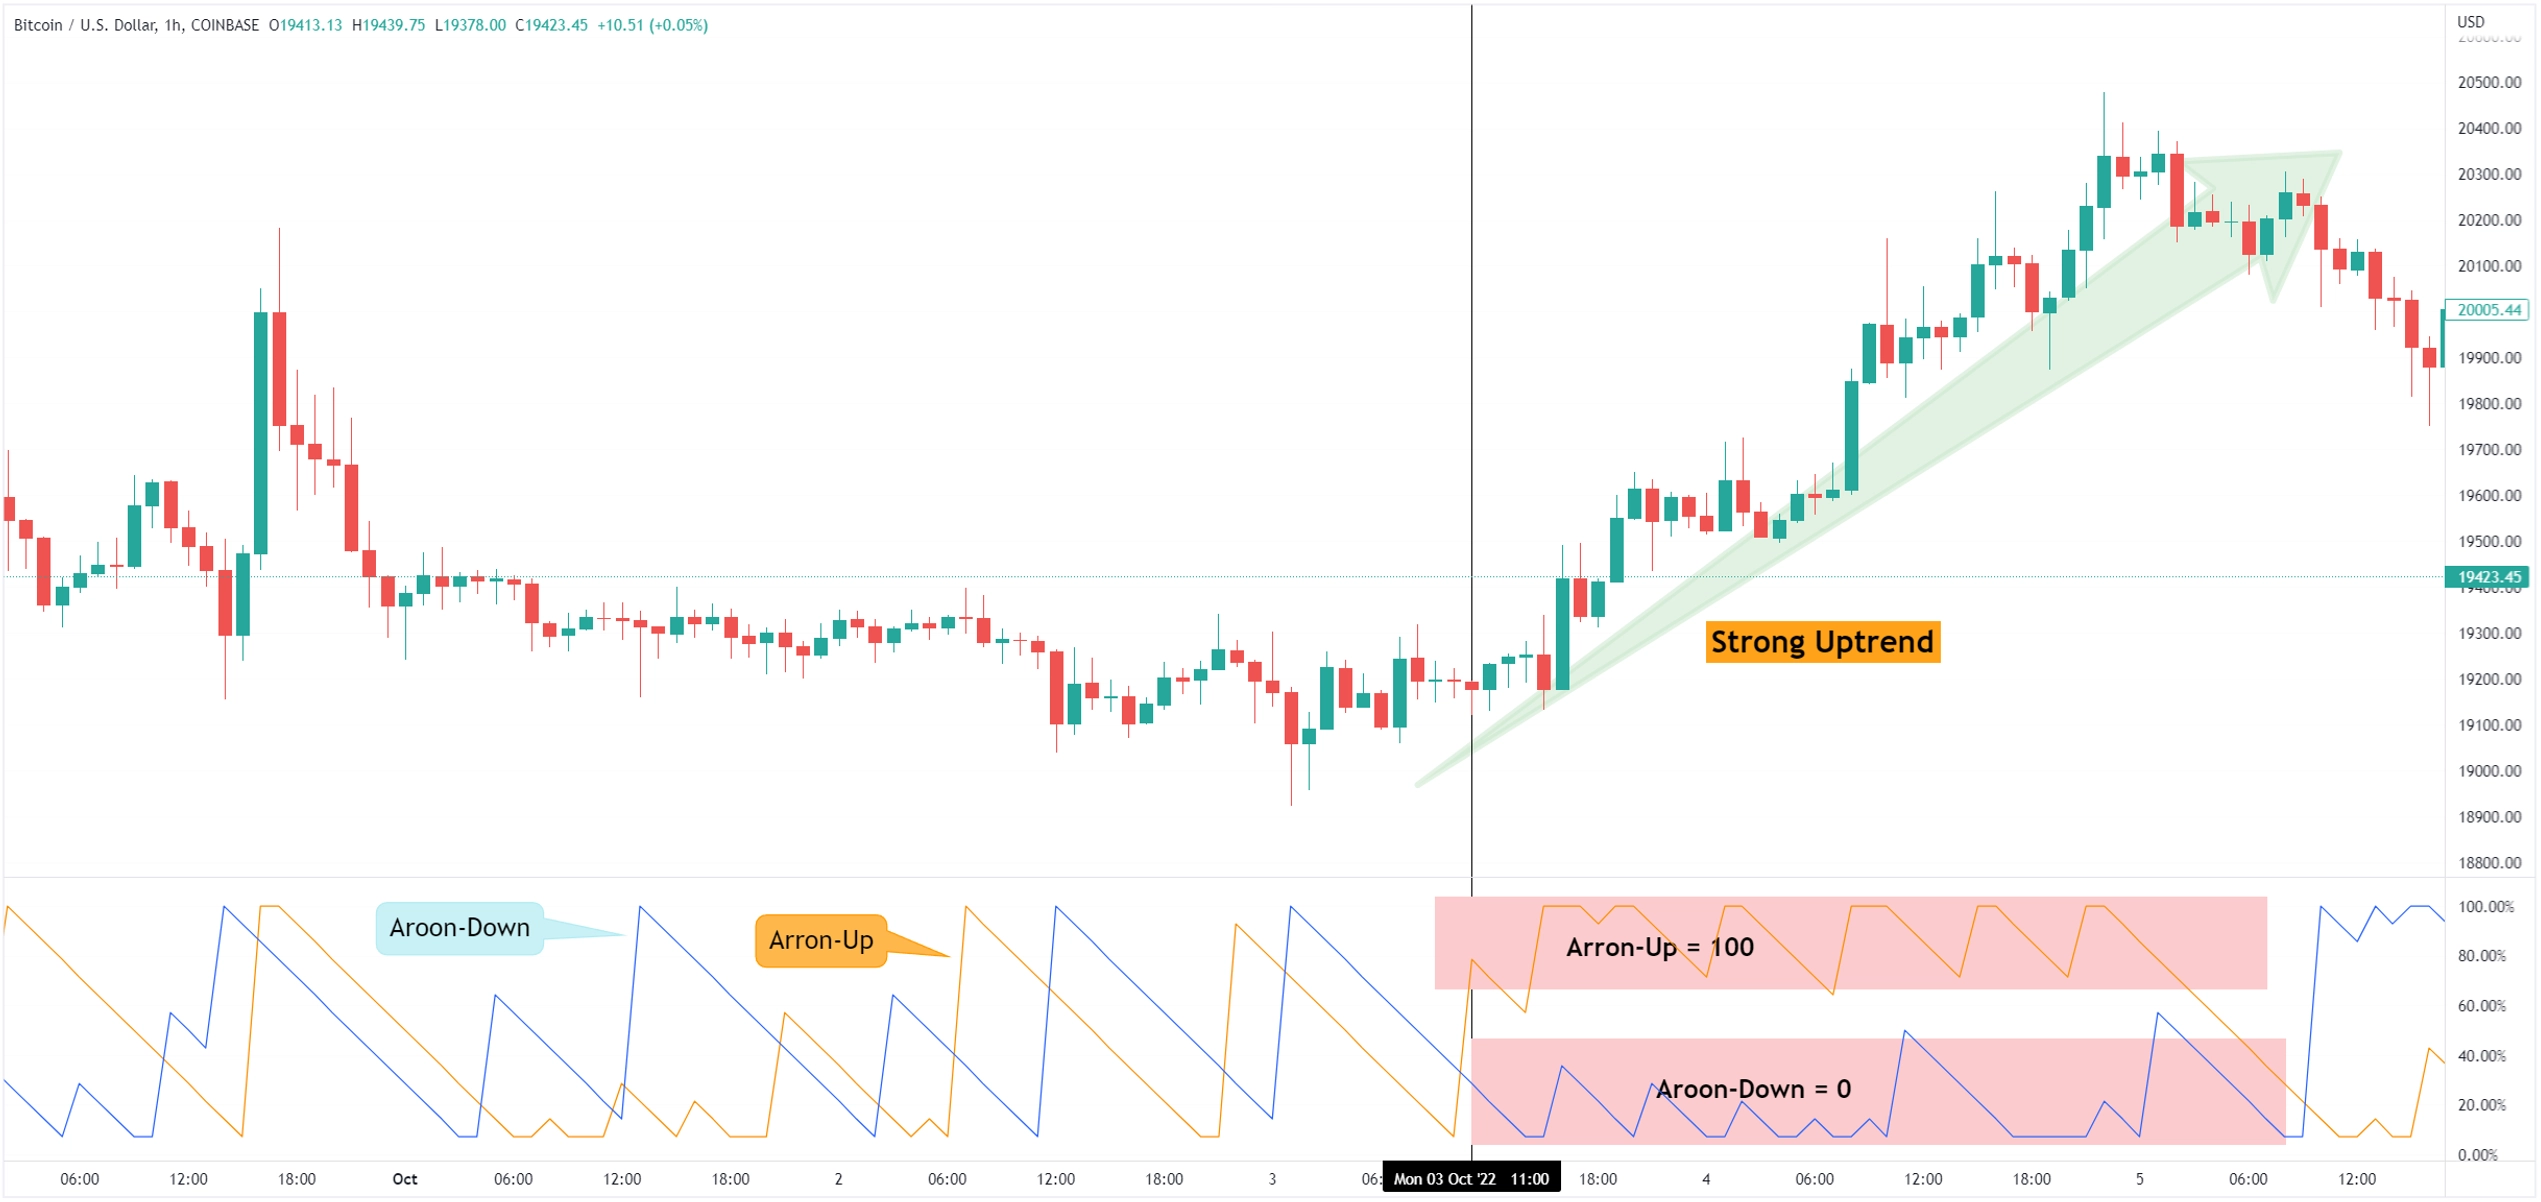
We have a strong uptrend when the Aroon-Up is close to 100, and at the same time, the Aroon-Down is close to zero.
We have a strong downtrend when the Aroon-Down is close to 100, and at the same time, the Aroon-Up is close to zero.
The more time the Aroon-Up is close to 100 and Aroon-Down is close to zero, the stronger the trend is. The Aroon oscillator came in handy in spotting the latest Bitcoin bounce from below $20,000.
Bottom line
When it comes to technical analysis, there are a lot of indicators out there that can be used to measure the strength of a trend.
However, one indicator that is often overlooked is the Aroon indicator. In this article, we have shown you how to use the Aroon indicator to measure the strength of a crypto trend. We hope that this will give you a better understanding of how to use this indicator and help you make more informed decisions when trading cryptocurrencies.


_webp.webp&w=3840&q=75)
_webp.webp&w=3840&q=75)


