The advantages of using multiple time frames
Have you ever wondered why there are so many time frames available on different exchanges and on Cryptohopper? Well today we will have a look at the different trading time frames and learn how you can profit from them.
Different traders different timeframes In the world of trading, different time frames serve different traders, a day trader for example, will use significantly different charts when compared to a position trader. Lets now dive deeper into which time frames traders most commonly use to analyze the markets.
Different time frames are used by traders for different purposes, for example the long time frames such as the Monthly, Weekly or Daily chart can be used by position traders. The daily, 4h and 1h chart can be used to determine the medium trend and to enter positions for swing trading. A day trader would normally use the 30min, 15min, and 5min chart in order to analyze the market.
You may have heard this saying before “ Trade with the trend” or “The trend is your friend”, but a coin can have different trends on different timeframes. So which one should you be looking at? This is what we will explore in the next section.
Using multiple timeframes simultaneously Even if they consider themselves a position trader, swing trader or day trader, most professionals watch different time frames at the same time. Most professional traders watch a longer time frame in order to determine the trend and a shorter time frame in order to find the pull-backs of the current trend.
For example a swing trader may use the daily chart to identify the larger trend at hand and the hourly chart to time his entries and exits. “Trend Indicators” as the name suggests, are useful in determining the current trend and are used by traders on the larger time frames. Some examples of trend indicators are: MESA, Parabolic SAR, EMA, DEMA, Weighted Moving Average, KAMA, Ichimoku Cloud etc. You can find all of the before mentioned indicators in Cryptohopper along with many more!
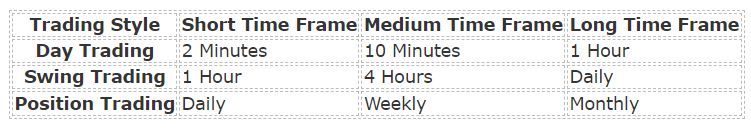
Alexander Elder, the acclaimed author of the book “Trading for a Living”, suggested using a triple screen trading system in which the trader looks at three different charts. In order to use the triple screen trading system, a trader must first identify his trading style. After identifying his trading style he then has to first choose his short time frame chart; from there he can use a time frame factor of 4-6 to transition to the medium time frame and then again to reach the long time frame. An example of this can be seen in the table below.
As previously mentioned other traders choose to look at a single time frame for entries and exits and at a longer time frame for identifying the trend. An example of such a system can be seen in the figure below.
On the upper chart we have the MESA plotted on the 1 day time frame. The MESA is an indicator mainly used to identify the current trend; in this example it is used to identify the broader trend to ensure the trader is always trading with the trend. A momentum
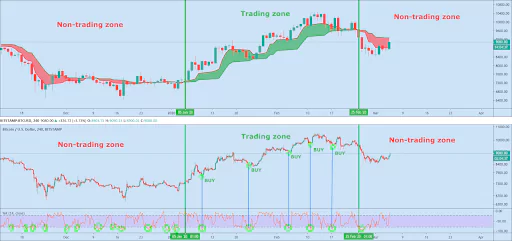
indicator can then be used to find the pullbacks of this trend on the shorter time frame. Williams % is a good example of such an indicator. Similarly to the RSI and other oscillators, Williams % oscillates between overbought and oversold zones.
As we want to trade with the trend we would buy each time Williams % shows oversold on the 4h chart and the MESA shows an uptrend on the daily chart.
You can use all of the previously mentioned indicators and many more in the strategy section of Cryptohopper, where you can combine them on any time frame you wish! You can go now to the strategy section and create your multiple time frame strategy in any way you shape or form.
Check out our last blog "Trade the Ichimoku Cloud like a pro!"


_webp.webp&w=3840&q=75)
_webp.webp&w=3840&q=75)


