.webp&w=1920&q=75)
Trading SAND with the DEMA (double exponential moving average) crossover is a strategy that can be used to beat the market. Let’s learn more about it!
Understand the DEMA
The Double Exponential Moving Average (DEMA) crossover strategy uses two DEMA lines: a short period line and a long period line.
The short period line represents the short-term trend of SAND, while the long period line represents the long-term trend.
When the short-period DEMA line crosses above the long-period DEMA line, it is considered a bullish signal, indicating that the short-term trend is becoming stronger than the long-term trend, and that it may be a good time to buy SAND.
Conversely, when the short-term DEMA line crosses below the long-term DEMA line, it is considered a bearish signal, indicating that the short-term trend is becoming weaker than the long-term trend and that it may be a good time to sell.
Best DEMA Crossover
We have tried multiple lengths for the short and long-term DEMA lines to see which ones work best.
In our strategy backtest, we took into account a 0.1% fee per trade, but no slippage was taken into account. All the trades were taken with the entire account.
The best DEMA lengths we found are:
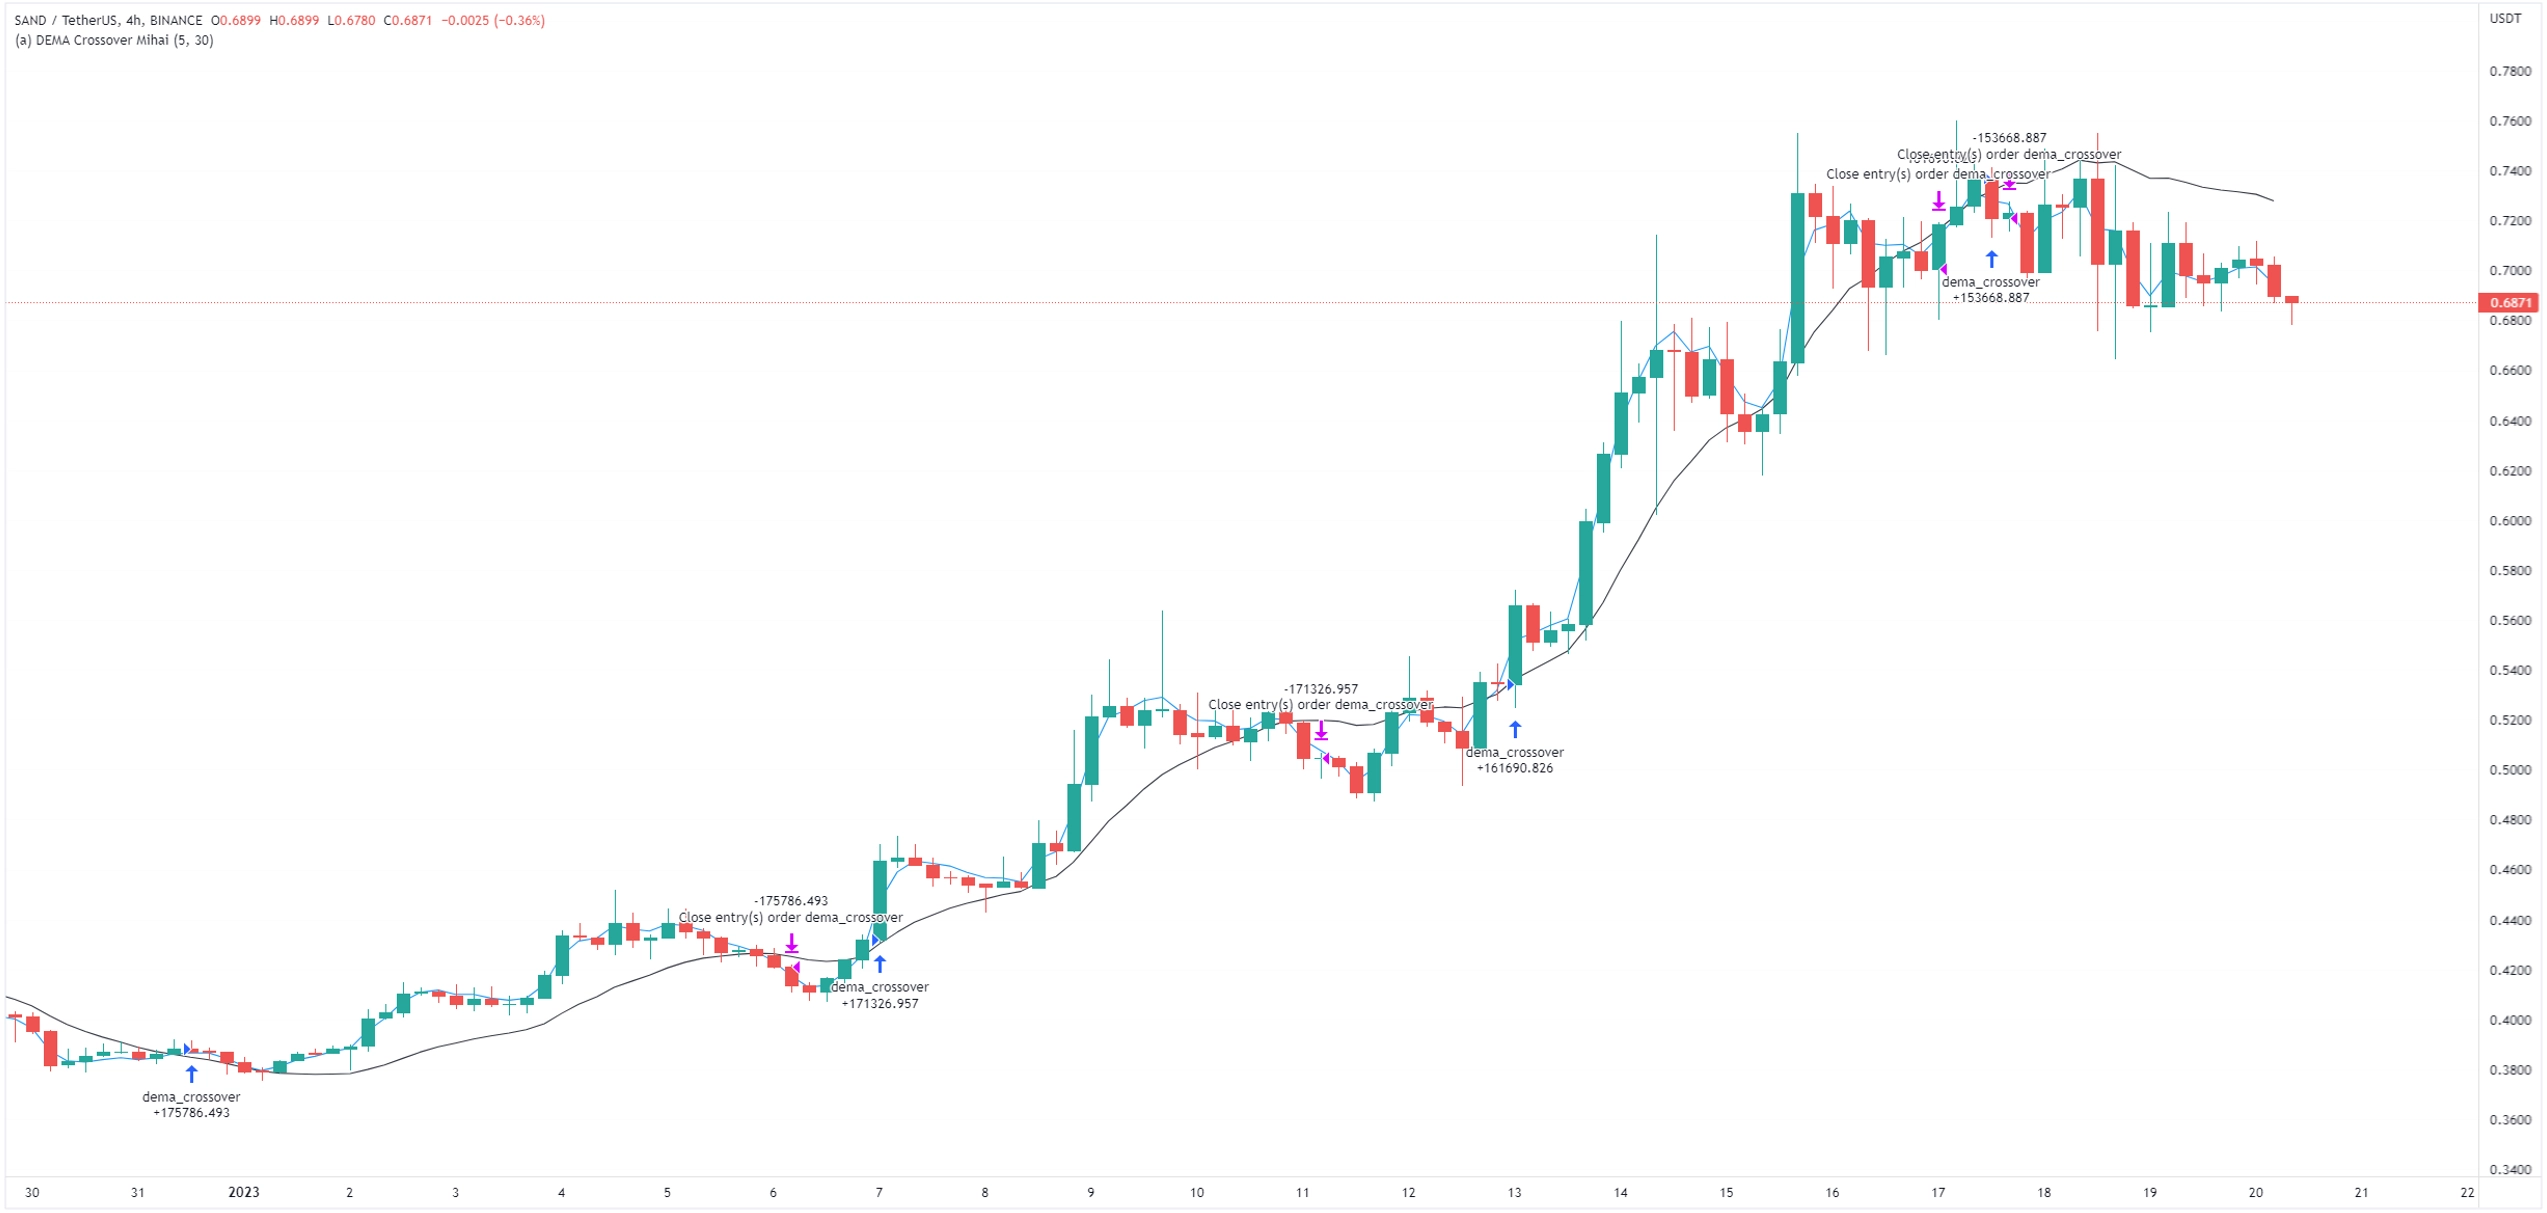
- Chart Period = 4H
- Short Period DEMA = 5
- Long Period DEMA = 30
This resulted in a 3,592% profit, while the buy-and-hold profit was only 1,431%. While this is much better than the buy and hold, it’s important to keep in mind that past performance does not guarantee future success.


_webp.webp)
_webp.webp)